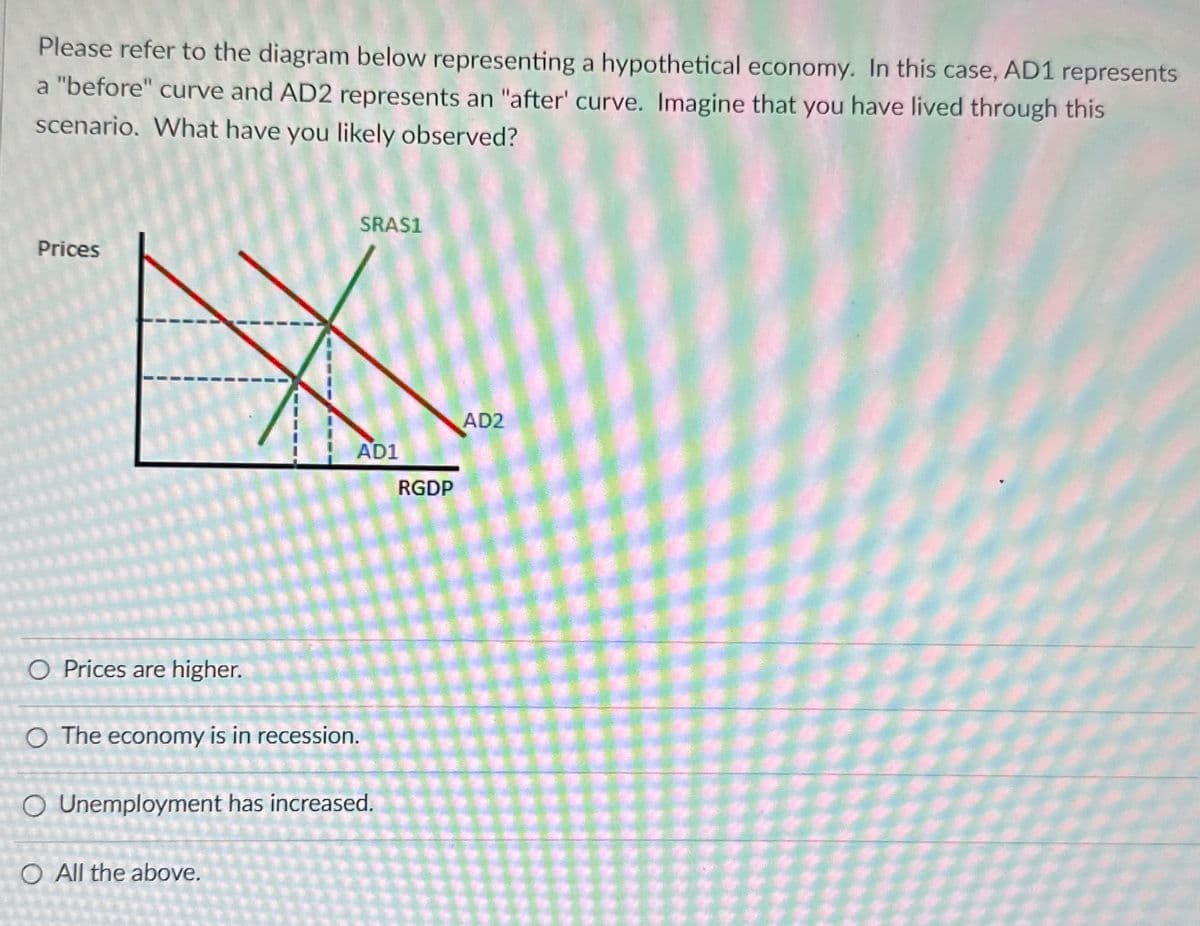
Please refer to the diagram below representing a hypothetical economy. In this case, AD1 represents a "before" curve and AD2 represents an "after' curve. Imagine that you have lived through this scenario. What have you likely observed?


Q: Suppose a single firm produces all of the output in a contestable market. Analysts determine that…
A: Market inverse demand function: P=400−4QFirm total cost function: C(Q)=16QThere is only one firm…
Q: 2. Suppose that Happy Land produces only two goods-food and suntan oil. Its production possibilities…
A: The production possibility schedule of Happy Land is given below:Food (pounds per month)Suntan oil…
Q: demand
A: The demand function in the US,Yus = 10- PusThe demand function in the EU,Yeu = 18 – 3 PeuThe…
Q: 2. Equilibrium rate of exchange Suppose that, initially, the foreign exchange market between the…
A: The issue we're attempting to address is determining the upside of the adjustment of demand for…
Q: 4 questions. Price (in dollars) Total revenue (in dollars) 50 0 10,500 4,500 P TR T 40 0100 700 9-20…
A: Business economics requires making decisions and allocating resources in complex market scenarios.…
Q: What is the percent change in price when the price drops from $6 to $5? Assume your answer is a…
A: The price has dropped from $6 to $5. And we have to find a percent change in price.
Q: Suppose an economy's real GDP is $31,500 in year 1 and $33,000 in year 2. The population is 110 in…
A: The real GDP is $31500 in the year 1.The real GDP is $33000 is year 2. The population is 110 in the…
Q: a. How much is GDP? $ b. How much is net investment? LA billion $ c. How much is national income? $…
A: Macroeconomics examines the working, composition, and dynamics of an economy. To comprehend and…
Q: balance budget policy
A: A balanced finances policy refers to a government's economic coverage wherein its total annual sales…
Q: 3. The monopolist's demand curve: the price effect and the quantity effect Aa Aa Louie's Fire…
A: Total revenue is the product of price charged and the quantity sold. It is the total amount of…
Q: Consider a second-price auction to sell an object in which there are 5 bidders. Recall that in a…
A: Game theory describes an equilibrium known as a Nash equilibrium, in which all participants have no…
Q: fast urgent
A: The objective of the question is to find the angles of a triangle given the lengths of its sides. We…
Q: The following graph shows the daily demand curve for bippitybops in Philadelphia. Use the green…
A: Total Revenue is defined as the total earnings that the producer earns from the sale of the output…
Q: what happens to the market price for rental cars as a result of the demand shift
A: The question is asking about the impact of a shift in demand on the market price for rental cars. In…
Q: Suppose the fixed cost of building a nuclear power plant is $1 billion. Suppose also that the only…
A: Marginal cost refers to the additional cost incurred by producing one more unit of a good or…
Q: 200 160 120 80 100 200 300 400 500 S Domestic steel mills lobby successfully to have a $40/ton…
A: An import tariff is a tax levied by a government on goods and services imported from other…
Q: (Use the Demand and Supply of Wheat Schedules below.) If a price of $10 temporarily exists in this…
A: surplus;The scenario of surplus occurs when the demand in economy is less than the supply of goods…
Q: profits
A: A fixed cost function remains constant regardless of the production quantity (q). To identify it, we…
Q: The figure to the right illustrates the demand for taxi rides in a large city. Suppose the price per…
A: The price elasticity is calculated as the percentage change in the demand for quantity divided by…
Q: Question (4): Consider a firm, where there is competition, looking to maximize its profits and the…
A: The problem outlined is a scenario analysis for a firm operating in a competitive market aiming to…
Q: a. Consider the following statement: "The market system is a profit-and-loss system." This statement…
A: C. True, because producer decisions are motivated by the attempt to earn profits.Explanation:The…
Q: Suppose that more consumers prefer the disposable cell phone over the smart phone because the…
A: The demand equation is The supply equation is
Q: For the government to run efficiently, it must collect tax revenue from the people. What is the…
A: The objective of the question is to identify the largest source of revenue for the federal…
Q: A quality control expert at LIFE batteries wants to test their new batteries. The design engineer…
A: The objective of the question is to find the probability that the mean battery life would be less…
Q: Consider a small, open economy inhabited by a large number of individuals who live for an infinite…
A: Exchange rate:It is the rate at which currencies are exchanged for another currency. It affects the…
Q: 2. Start from the income dynamics equation on slide 45: a 1-a = ( ² ) * (1₁1) ² - a Yt+1 = (a) Show…
A: The steady-state level of income per capita refers to the long-term equilibrium level of income per…
Q: How would the equilibrium price (P) and equilibrium quantity (Q) for a good be affected if there was…
A: When there is a simultaneous increase in demand and a decrease in supply for a good, the effect on…
Q: Which of the following is NOT a characteristic of oligopoly? A. Few large firms dominate the market…
A: The firms that have a small number of suppliers in the market are referred to as oligopoly markets.…
Q: Recently, some members of Congress have proposed a law that would make price stability the sole goal…
A: Expansionary monetary policy stimulates aggregate demand. In case of recessions, expansionary…
Q: answer for d and e.
A: At the equilibrium price, the quantity demanded is equal to the quantity supplied.Equilibrium occurs…
Q: Use the photo at exercise 14 to solve the problem below With the Firm Y response function…
A: In economics, the game of Stackelberg, two players with the leading and trailing firms function in…
Q: Suppose economists observe that an increase in government spending of $12 billion raises the total…
A: Macroeconomics examines the working, composition, and dynamics of an economy. To comprehend and…
Q: There are three industrial plants in Simontown: Plant A B C Current Pollution Level Cost of Reducing…
A: According to given in the question, each plant is given 40 tradeable permit and each permit allows…
Q: PRICE (Dollars per bowl) 5.25 4.50 3.75 3.00 2.25 1.50 0.75 0 Demand Price 02 4 8 10 12 14 QUANTITY…
A: The demand curve is the graphical representation of different quantities of commodities that the…
Q: Which of the following is an example of a negative externality? A. A beekeeper selling honey at a…
A: A negative externality refers to a cost that is suffered by a third party as a result of an economic…
Q: Draw a correctly labeled steel market. Assume that the government passes strict pollution…
A: The desire of an individual to buy a product according to the willingness and ability to purchase a…
Q: What was the role of the 1980s Third World debt crises in setting the stage for the “commodity…
A: The objective of the question is to understand the connection between the Third World debt crisis of…
Q: Why do people hold money? How will an increase in the interest rate influence the amount of money…
A: Money can be defined in various ways depending on the specific context and…
Q: The standard deviation of the scores on a skill evaluation test is 363 points with a mean of 1239…
A: The objective of this question is to find the probability that the mean of a sample would differ…
Q: Suppose that Super Market increased the price of a dozen free - range eggs from $5.50 to $6.50. As a…
A: The objective of the question is to calculate the price elasticity of demand for the eggs sold in…
Q: pportunity co
A: Opportunity fee refers to the price of the next great opportunity that is forgone while a choice is…
Q: A quality control expert at LIFE Batteries wants to test their new batteries. The design engineer…
A: The objective of this question is to find the probability that the mean battery life of a sample of…
Q: c. Suppose that public policy alters the saving rate so that the economy reaches the Golden Rule…
A: This concept is a mathematical model that describes the relationship between production output and…
Q: 14. A supply and demand puzzle The following graph presents the market for bikes in 2018. Between…
A: The demand curve shows an inverse relationship between price and quantity demanded. Demand is a…
Q: Suppose the graph depicted market demand for British cars sold in the United States. A tariff of…
A: This can be described as a concept that shows the contribution of an individual, organisation or any…
Q: The Utah Mining Corporation is set to open a gold mine near Provo, Utah. According to the treasurer,…
A: Internal rate of return or IRR is regarded as one of the most important Capital Budgeting…
Q: The market supply is MC = 10 + 4Q but the suppliers can only supply 5 units in total! The Market…
A: The market supply is The market demand is The suppliers can only supply 5 units in total.
Q: Which of the following statements about labour productivity (Y/L), also known as the average product…
A: Answered belowExplanation:The correct statements are: a. With a standard production function, if L…
Q: What will happen to the equilibrium price and quantity of cotton shirts if there is an increase in…
A: Market equilibrium refers to a scenario at which the quantity demanded is equal to the quantity…
Q: inflation rate
A: The inflation rate refers to the share exchange within the trendy fee degree of goods and offerings…


Trending now
This is a popular solution!

Step by step
Solved in 4 steps


- Review the problem in the Work It Out titled"Interpreting the AD/AS Model." Like the informationprovided in that feature, Table 24.2 shows informationon aggregate supply, aggregate demand, and the pricelevel for the imaginary country of Xurbia. a. Plot the AD/AS diagram from the data. Identifythe equilibrium.b. Imagine that, as a result of a government taxcut, aggregate demand becomes higher by 50 atevery price level. Identify the new equilibrium.c. How will the new equilibrium alter output? Howwill it alter the price level? What do you thinkwill happen to employment?Draw and properly label an AD-AS model to show Keynesian, intermediate, and neoclassical zones. Then briefly explain the level of unemployment, inflation and real gdp in each zone, and confirm wether all three goals of a macro economy are being achieved in each zone .On the graph, label your starting AD line as AD 2019. Draw a new AD line showing the change to AD due to the pandemic. Label your starting SRAS line as SRAS 2019. Draw a new SRAS line showing the change to supply due to the pandemic.Label the new short-run equilibrium RGDP and Price Level. Does output (i.e. RGDP) increase or decrease in your model? Does the price level increase or decrease in your model? According to the AD-AS model when RGDP falls the unemployment rises and vice versa. Does your graph indicate an increase or decrease in the unemployment rate
- Draw and properly label an AD-AS model to show Keynesian, intermediate, and neoclassical zones. Then, briefly explain the levels of unemployment, inflation and real GDP in each zone, and also confirm whether all three goals of a macro economy are being achieved in each zone. 2. Draw and properly label the AD-AS graphs or one AD-AS graph to show recessionary and inflationary gaps. Then, discuss in detail how Keynesians suggest that recessionary and inflationary gaps be closed. 3. Draw and properly label AD-AS graphs or one AD-AS graph to show recessionary and inflationary gaps. Then, discuss in detail how neoclassicals suggest that recessionary and inflationary gaps be closed.urgent plz dont copy from anywhere Question 3 [Consider how the COVID-19 pandemic has caused major disruption in global supply chain affecting the supply of critical inputs to production. This has negatively affected the supply side of Singaporean economy on a large scale.] (a) [Illustrate the impact of this supply-side disruption on the Singaporean economy using the AD-AS model. Assume that the economy was initially in good shape and operating at its potential represented by Y*. Provide an explanation to explain what is happening in your diagram. (100 words)] (b) [Following this shock to the economy, as described in part (a) of this question, indicate what would be the response of the Central Bank for each of the scenarios below. Highlight any trade-offs that the Central Bank must consider for each of these potential responses (100 words total) Scenario (i) - Assume the Central Bank is most concerned about inflation. Scenario (ii) - Assume the Central Bank is most concerned about…6.1.What is an AD-AS model and what does such a model as per the givendiagram essentially focus on?6.2.Discuss the diagram in detail by first explaining what leads to step Step 1(representing a shift in curves on the diagram) and indicating what occursto cause shifts in some of the curves. Then discuss Step 2 (whichrepresents other macroeconomic changes) and indicate what happens toother variables when there are shifts in some of the curves as per Step 1. 6.3.What, in general, do the points of intersection between the AS and AS2curves and the AD curve show?6.4.When the LAS curve moves to the right to LRAS2, what exactly do thepoints of intersection between the AS and AS curves and the AD1 curve,indicated as point 1 and point 2, reflect on the diagram?
- Draw and properly label AD-AS graph(s) to show recessionary and inflationary gaps. Then, discuss neoclassical perspectives to closing recessionary and inflationary gaps.Mexico is experiencing a Recession due to decrease demand. Draw a correcly labeled AS/AD model representing where the economy is relative to the Natural Rate of Unemployment.In Figure 1 above,how does the AD-AS model reflect the idea that governments cannot increase real GDP beyond an economy’s equilibrium level that the free-market economy is able to produce? Explain your answer. 2.1. In Figure 2 above, what are the factors that may cause the aggregate demand to shift from AD to AD1? What is the difference between demand pull inflation, cost push inflation, and recession? 2.2. Define and describe: the aggregate supply (AS) curve in the immediate short run. the aggregate supply (AS) curve in the short run. the aggregate supply (AS) in the long run. 3. Listen: Podcast: The Economics of Fiscal Stimulus - Econ EveryDay The Covid-19 pandemic shifted the aggregate supply and aggregate demand curves to the left. Did that increase or decrease real GDP, employment, and inflation rate? Explain your answer.
- Assume that an economy is initially operating at the natural rate of output (full employmentoutput). Use the AD-AS model to illustrate graphically the effects on price and output of areduction in government spending. Explain your assumptions with respect to the range ofaggregate supply of your analysis.E3 Suppose the government of a typical developing country increased the salary of civil servants at a time when there is a bumper harvest due to timely rainfall. show using your knowledge of the AD-AS framework, What will happen to prices?Review the problem shown in the Work It Out titled "Interpreting the AD/AS Model." Like the information provided in that feature, Table 24.2 shows information on aggregate supply, aggregate demand, and the price level for the imaginary country of Xurbia. Price Level AD AS 110 700 600 120 690 640 130 680 680 140 670 720 150 660 740 160 650 760 170 640 770 Table24.2 Price Level: AD/AS Plot the AD/AS diagram from the data shown. Identify the equilibrium. Imagine that, as a result of a government tax cut, aggregate demand becomes higher by 50 at every price level. Identify the new equilibrium. How will the new equilibrium alter output? How will it alter the price level? What do you think will happen to employment?