Plot by hand the survivorship data for the Gray Squirrel life table. A survivorship curve has age or age class (x) on the x-axis and lx on the y-axis.
Plot by hand the survivorship data for the Gray Squirrel life table. A survivorship curve has age or age class (x) on the x-axis and lx on the y-axis.

Biology: The Unity and Diversity of Life (MindTap Course List)
15th Edition
ISBN:9781337408332
Author:Cecie Starr, Ralph Taggart, Christine Evers, Lisa Starr
Publisher:Cecie Starr, Ralph Taggart, Christine Evers, Lisa Starr
Chapter44: Population Ecology
Section: Chapter Questions
Problem 4CT: The age structure diagrams for two hypothetical populations are shown below. Describe the growth...

Related questions

Question
Plot by hand the survivorship data for the Gray Squirrel life table. A survivorship curve has age or
age class (x) on the x-axis and lx on the y-axis.
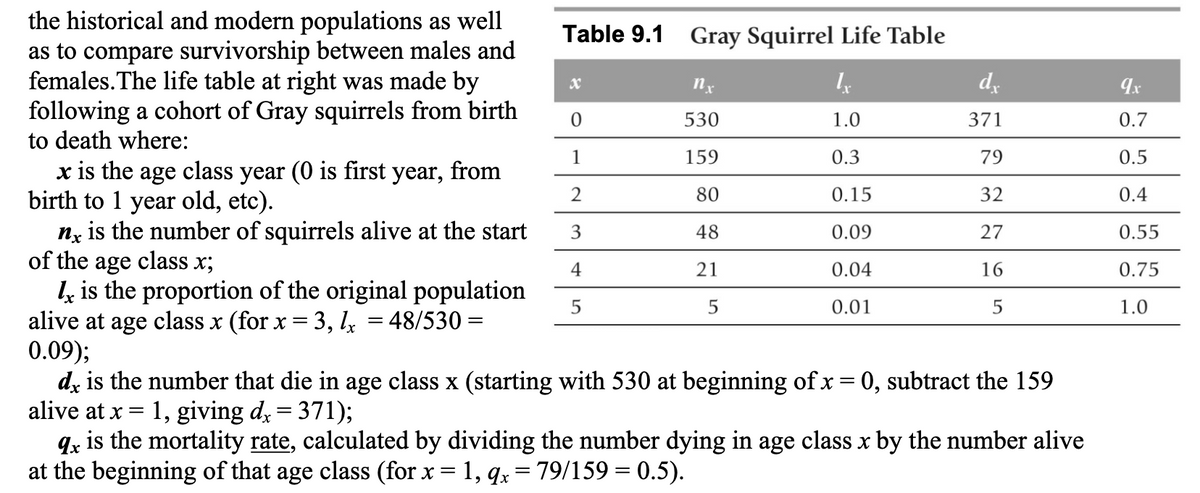
Transcribed Image Text:the historical and modern populations as well
as to compare survivorship between males and
females. The life table at right was made by
following a cohort of Gray squirrels from birth
to death where:
x is the age class year (0 is first year, from
birth to 1 year old, etc).
nx is the number of squirrels alive at the start
of the age class x;
Ix is the proportion of the original population
alive at age class x (for x = 3, lx = 48/530=
0.09);
Table 9.1 Gray Squirrel Life Table
0
1
2
3
4
5
nx
530
159
80
48
21
5
1.0
0.3
0.15
0.09
0.04
0.01
dx
371
79
32
27
16
5
dx is the number that die in age class x (starting with 530 at beginning of x = 0, subtract the 159
alive at x = 1, giving dx = 371);
qx is the mortality rate, calculated by dividing the number dying in age class x by the number alive
at the beginning of that age class (for x = 1, qx = 79/159 = 0.5).
9x
0.7
0.5
0.4
0.55
0.75
1.0
Expert Solution
This question has been solved!
Explore an expertly crafted, step-by-step solution for a thorough understanding of key concepts.

This is a popular solution!

Trending now
This is a popular solution!

Step by step
Solved in 2 steps with 1 images

Knowledge Booster


Learn more about
Need a deep-dive on the concept behind this application? Look no further. Learn more about this topic, biology and related others by exploring similar questions and additional content below.Recommended textbooks for you
Biology: The Unity and Diversity of Life (MindTap…
Biology
ISBN:
9781337408332
Author:
Cecie Starr, Ralph Taggart, Christine Evers, Lisa Starr
Publisher:
Cengage Learning

Concepts of Biology
Biology
ISBN:
9781938168116
Author:
Samantha Fowler, Rebecca Roush, James Wise
Publisher:
OpenStax College

Biology Today and Tomorrow without Physiology (Mi…
Biology
ISBN:
9781305117396
Author:
Cecie Starr, Christine Evers, Lisa Starr
Publisher:
Cengage Learning
Biology: The Unity and Diversity of Life (MindTap…
Biology
ISBN:
9781337408332
Author:
Cecie Starr, Ralph Taggart, Christine Evers, Lisa Starr
Publisher:
Cengage Learning
Concepts of Biology
Biology
ISBN:
9781938168116
Author:
Samantha Fowler, Rebecca Roush, James Wise
Publisher:
OpenStax College
Biology Today and Tomorrow without Physiology (Mi…
Biology
ISBN:
9781305117396
Author:
Cecie Starr, Christine Evers, Lisa Starr
Publisher:
Cengage Learning