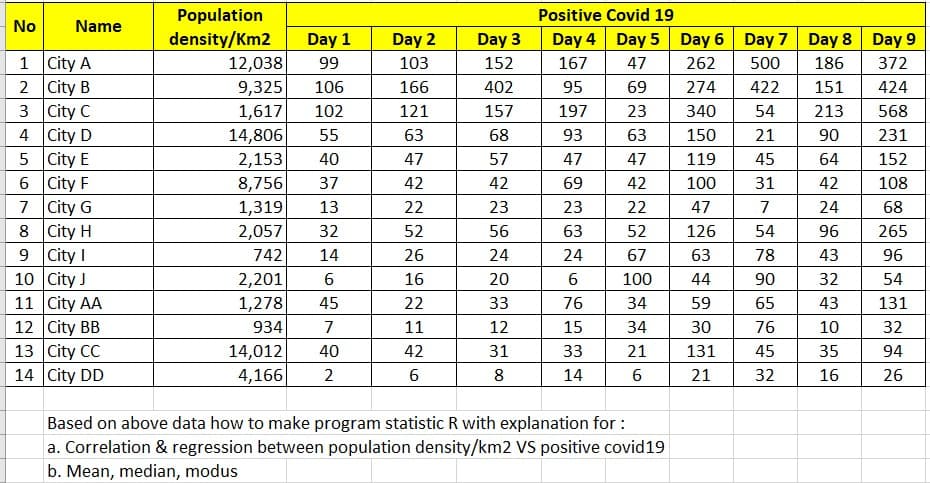
Population Positive Covid 19 No Name density/Km2 Day 1 Day 2 Day 3 Day 4 Day 5 Day 6 Day 7 Day 8 Day 9 1 City A 2 City B 3 City C 4 City D 5 City E 6 City F 7 City G 8 City 9 City I 10 City J 11 City AA 12 City BB 13 City CC 14 City DD 12,038 99 103 152 167 47 262 500 186 372 9,325 106 166 402 95 69 274 422 151 424 1,617 102 121 157 197 23 340 54 213 568 14,806 55 63 68 93 63 150 21 90 231 2,153 40 47 57 47 47 119 45 64 152 8,756 37 42 42 69 42 100 31 42 108 1,319 13 22 23 23 22 47 7 24 68 2,057 32 52 56 63 52 126 54 96 265 742 14 26 24 24 67 63 78 43 96 2,201 6. 16 20 6. 100 44 90 32 54 1,278 45 22 33 76 34 59 65 43 131 934 7 11 12 15 34 30 76 10 32 14,012 40 42 31 33 21 131 45 35 94 4,166 2 8 14 21 32 16 26 Based on above data how to make program statistic R with explanation for : a. Correlation & regression between population density/km2 VS positive covid19 b. Mean, median, modus
Population Positive Covid 19 No Name density/Km2 Day 1 Day 2 Day 3 Day 4 Day 5 Day 6 Day 7 Day 8 Day 9 1 City A 2 City B 3 City C 4 City D 5 City E 6 City F 7 City G 8 City 9 City I 10 City J 11 City AA 12 City BB 13 City CC 14 City DD 12,038 99 103 152 167 47 262 500 186 372 9,325 106 166 402 95 69 274 422 151 424 1,617 102 121 157 197 23 340 54 213 568 14,806 55 63 68 93 63 150 21 90 231 2,153 40 47 57 47 47 119 45 64 152 8,756 37 42 42 69 42 100 31 42 108 1,319 13 22 23 23 22 47 7 24 68 2,057 32 52 56 63 52 126 54 96 265 742 14 26 24 24 67 63 78 43 96 2,201 6. 16 20 6. 100 44 90 32 54 1,278 45 22 33 76 34 59 65 43 131 934 7 11 12 15 34 30 76 10 32 14,012 40 42 31 33 21 131 45 35 94 4,166 2 8 14 21 32 16 26 Based on above data how to make program statistic R with explanation for : a. Correlation & regression between population density/km2 VS positive covid19 b. Mean, median, modus

Chapter6: Systems Of Equations And Inequalities
Section: Chapter Questions
Problem 19RE

Related questions
Question
100%
How to make R program for statistic problem as attached?
Transcribed Image Text:Population
Positive Covid 19
No
Name
density/Km2
Day 1
Day 2
Day 3
Day 4 Day 5
Day 6 Day 7 Day 8 Day 9
1 City A
2 City B
3 City C
4 City D
5 City E
6 City F
7 City G
8 City
9 City I
10 City J
11 City AA
12 City BB
13 City CC
14 City DD
12,038
99
103
152
167
47
262
500
186
372
9,325
106
166
402
95
69
274
422
151
424
1,617
102
121
157
197
23
340
54
213
568
14,806
55
63
68
93
63
150
21
90
231
2,153
40
47
57
47
47
119
45
64
152
8,756
37
42
42
69
42
100
31
42
108
1,319
13
22
23
23
22
47
7
24
68
2,057
32
52
56
63
52
126
54
96
265
742
14
26
24
24
67
63
78
43
96
2,201
6.
16
20
6.
100
44
90
32
54
1,278
45
22
33
76
34
59
65
43
131
934
7
11
12
15
34
30
76
10
32
14,012
40
42
31
33
21
131
45
35
94
4,166
2
8
14
21
32
16
26
Based on above data how to make program statistic R with explanation for :
a. Correlation & regression between population density/km2 VS positive covid19
b. Mean, median, modus
Expert Solution
This question has been solved!
Explore an expertly crafted, step-by-step solution for a thorough understanding of key concepts.

Step by step
Solved in 3 steps with 2 images

Recommended textbooks for you

Elementary Linear Algebra (MindTap Course List)
Algebra
ISBN:
9781305658004
Author:
Ron Larson
Publisher:
Cengage Learning

Algebra & Trigonometry with Analytic Geometry
Algebra
ISBN:
9781133382119
Author:
Swokowski
Publisher:
Cengage
Elementary Linear Algebra (MindTap Course List)
Algebra
ISBN:
9781305658004
Author:
Ron Larson
Publisher:
Cengage Learning
Algebra & Trigonometry with Analytic Geometry
Algebra
ISBN:
9781133382119
Author:
Swokowski
Publisher:
Cengage

Functions and Change: A Modeling Approach to Coll…
Algebra
ISBN:
9781337111348
Author:
Bruce Crauder, Benny Evans, Alan Noell
Publisher:
Cengage Learning