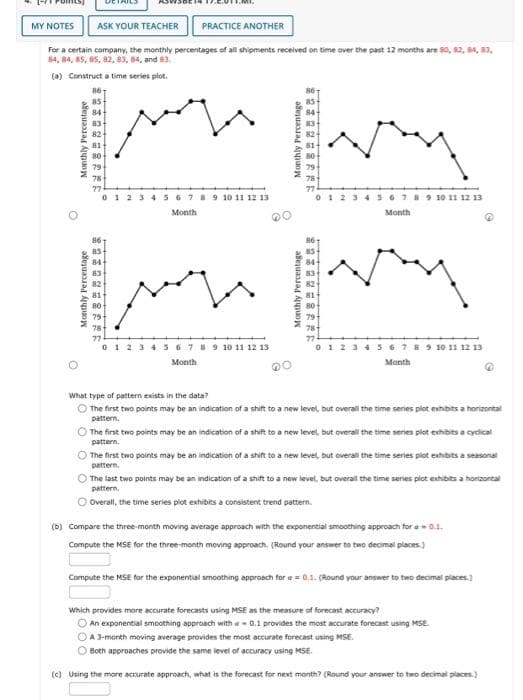
for a certain company, the monthy percentages ot al hipments received on time over the past 12 months are , 2, , , 4, 4, 85, 5, 2, 83, 4, and 3 (4) Construct a time series plot. 36789 10 11 12 1 430710 11 12 13 Month Month Monthly Percentage aeyuaa Monthly Percentage
for a certain company, the monthy percentages ot al hipments received on time over the past 12 months are , 2, , , 4, 4, 85, 5, 2, 83, 4, and 3 (4) Construct a time series plot. 36789 10 11 12 1 430710 11 12 13 Month Month Monthly Percentage aeyuaa Monthly Percentage

MATLAB: An Introduction with Applications
6th Edition
ISBN:9781119256830
Author:Amos Gilat
Publisher:Amos Gilat
Chapter1: Starting With Matlab
Section: Chapter Questions
Problem 1P

Related questions
Question
Transcribed Image Text:MY NOTES
ASK YOUR TEACHER
PRACTICE ANOTHER
For a certain company, the monthly percentages of all shipments received on time over the past 12 months are s0, 2, 84, 83,
84, 84, 85, 85, 82, 83, 84, and 83.
(a) Construct a time series plot.
86
85
78
77
0123456789 10 11 12 13
123456 789 10 11 12 13
Month
Month
0 123 4 5 6789 10 11 12 13
12345678 9 10 11 12 13
Month
Manth
What type of pattern exists in the data?
O The first two points may be an indication of a shift to a new level, but overall the time series plot exhibits a horizontal
pattern.
The first two points may be an indication of a shift to a new level, but overall the time series plot exhbits a cyclical
pattern.
The first two points may be an indication of a shift to a new level, but overal the time series plot exhibits a seasonal
pattern,
The last two points may be an indication of a shift to a new level, but overall the time series plot exhibits a hortzontal
pattern.
Overall, the time series plot exhibits a consistent trend patterm.
(b) Compare the three-month moving average approach with the exponential smoothing approach for a01.
Compute the MSE for the three-month moving approach. (Round your answer to two decimal places.)
Compute the MSE for the exponential smoothing approach for a = 0.1. (Round your answer to two decimal places.)
Which provides more accurate forecasts using MSE as the measure of forecast accuracy?
O An exponential smoothing approach with a- 0.1 provides the most accurate forecast using MSE.
A 3-month moving average provides the most accurate forecast using MSE.
Both approaches provide the same level of accuracy using MSE.
(c) Using the more accurate approach, what is the forecast for next month? (Round your answer to two decimal places.)
Expert Solution
This question has been solved!
Explore an expertly crafted, step-by-step solution for a thorough understanding of key concepts.

Step by step
Solved in 4 steps with 13 images

Recommended textbooks for you
MATLAB: An Introduction with Applications
Statistics
ISBN:
9781119256830
Author:
Amos Gilat
Publisher:
John Wiley & Sons Inc

Probability and Statistics for Engineering and th…
Statistics
ISBN:
9781305251809
Author:
Jay L. Devore
Publisher:
Cengage Learning

Statistics for The Behavioral Sciences (MindTap C…
Statistics
ISBN:
9781305504912
Author:
Frederick J Gravetter, Larry B. Wallnau
Publisher:
Cengage Learning
MATLAB: An Introduction with Applications
Statistics
ISBN:
9781119256830
Author:
Amos Gilat
Publisher:
John Wiley & Sons Inc
Probability and Statistics for Engineering and th…
Statistics
ISBN:
9781305251809
Author:
Jay L. Devore
Publisher:
Cengage Learning
Statistics for The Behavioral Sciences (MindTap C…
Statistics
ISBN:
9781305504912
Author:
Frederick J Gravetter, Larry B. Wallnau
Publisher:
Cengage Learning

Elementary Statistics: Picturing the World (7th E…
Statistics
ISBN:
9780134683416
Author:
Ron Larson, Betsy Farber
Publisher:
PEARSON

The Basic Practice of Statistics
Statistics
ISBN:
9781319042578
Author:
David S. Moore, William I. Notz, Michael A. Fligner
Publisher:
W. H. Freeman

Introduction to the Practice of Statistics
Statistics
ISBN:
9781319013387
Author:
David S. Moore, George P. McCabe, Bruce A. Craig
Publisher:
W. H. Freeman