population size 5 10 15 20 25 M 50 100 150 time Explain what phenomenon this graph is demonstrating if the dashed line represents host population size and the solid line represents parasite population size.
population size 5 10 15 20 25 M 50 100 150 time Explain what phenomenon this graph is demonstrating if the dashed line represents host population size and the solid line represents parasite population size.

Biology 2e
2nd Edition
ISBN:9781947172517
Author:Matthew Douglas, Jung Choi, Mary Ann Clark
Publisher:Matthew Douglas, Jung Choi, Mary Ann Clark
Chapter45: Population And Community Ecology
Section: Chapter Questions
Problem 11RQ: Species with limited resources usually exhibit a(n)______ growth curve. logistic logical...

Related questions
Question
Q10.3
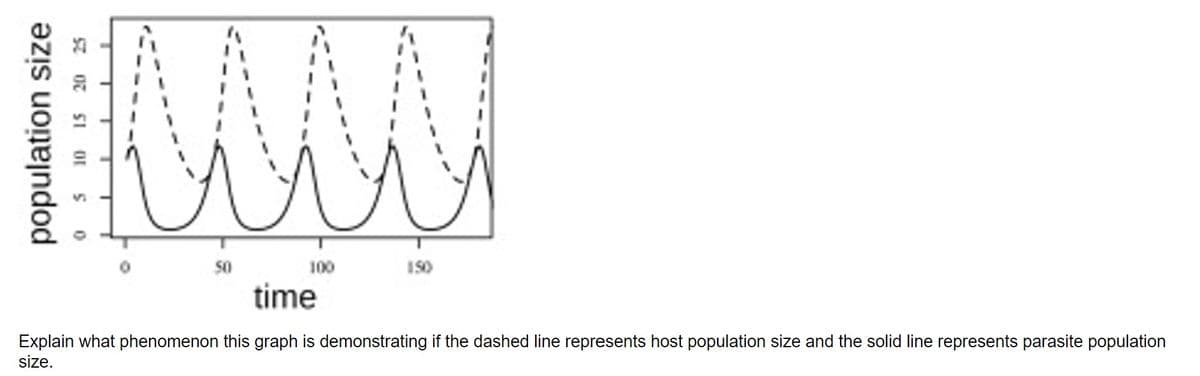
Transcribed Image Text:population size
5
10 15 20 25
M
50
100
150
time
Explain what phenomenon this graph is demonstrating if the dashed line represents host population size and the solid line represents parasite population
size.
Expert Solution
This question has been solved!
Explore an expertly crafted, step-by-step solution for a thorough understanding of key concepts.

This is a popular solution!

Trending now
This is a popular solution!

Step by step
Solved in 1 steps

Recommended textbooks for you
Biology 2e
Biology
ISBN:
9781947172517
Author:
Matthew Douglas, Jung Choi, Mary Ann Clark
Publisher:
OpenStax

Biology: The Unity and Diversity of Life (MindTap…
Biology
ISBN:
9781337408332
Author:
Cecie Starr, Ralph Taggart, Christine Evers, Lisa Starr
Publisher:
Cengage Learning

Biology 2e
Biology
ISBN:
9781947172517
Author:
Matthew Douglas, Jung Choi, Mary Ann Clark
Publisher:
OpenStax
Biology: The Unity and Diversity of Life (MindTap…
Biology
ISBN:
9781337408332
Author:
Cecie Starr, Ralph Taggart, Christine Evers, Lisa Starr
Publisher:
Cengage Learning