Potential AS Potential GDP, GDP2 AS2 Real GDP (trillions of 2012 dollars) he change in potential real GDP and aggregate supply shown in the graph above can b esult of O a. an increase in the real wage rate. O b. a decrease in the money price of oil. O C. an increase in the quantity of capital. O d. a decrease in the money wage rate.
Potential AS Potential GDP, GDP2 AS2 Real GDP (trillions of 2012 dollars) he change in potential real GDP and aggregate supply shown in the graph above can b esult of O a. an increase in the real wage rate. O b. a decrease in the money price of oil. O C. an increase in the quantity of capital. O d. a decrease in the money wage rate.

Chapter11: Gross Domestic Product
Section: Chapter Questions
Problem 12SQ

Related questions
Question
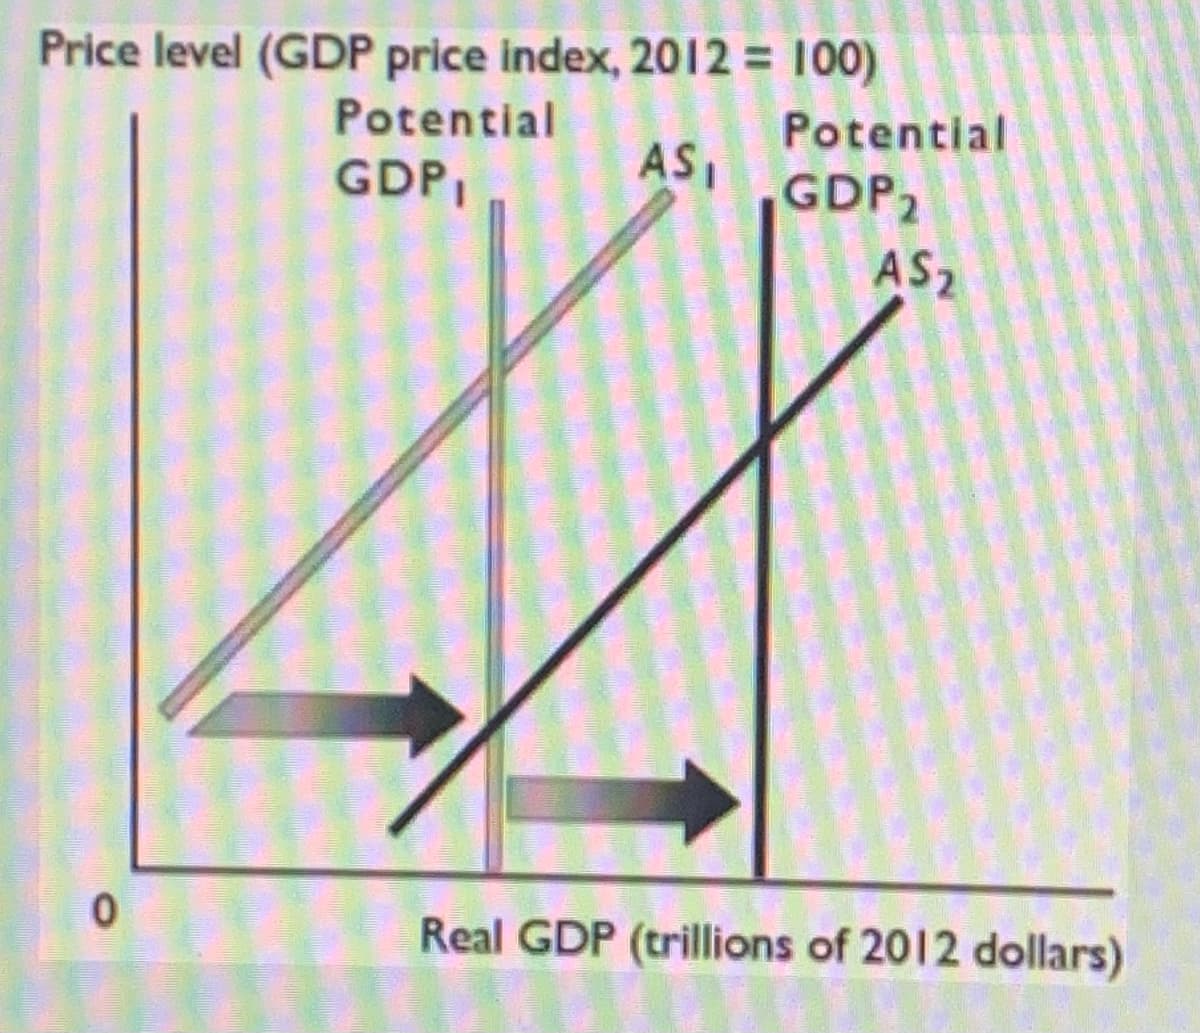
Transcribed Image Text:Price level (GDP price index, 2012 = 100)
Potential
Potential
GDP,
AS,
GDP2
AS2
Real GDP (trillions of 2012 dollars)
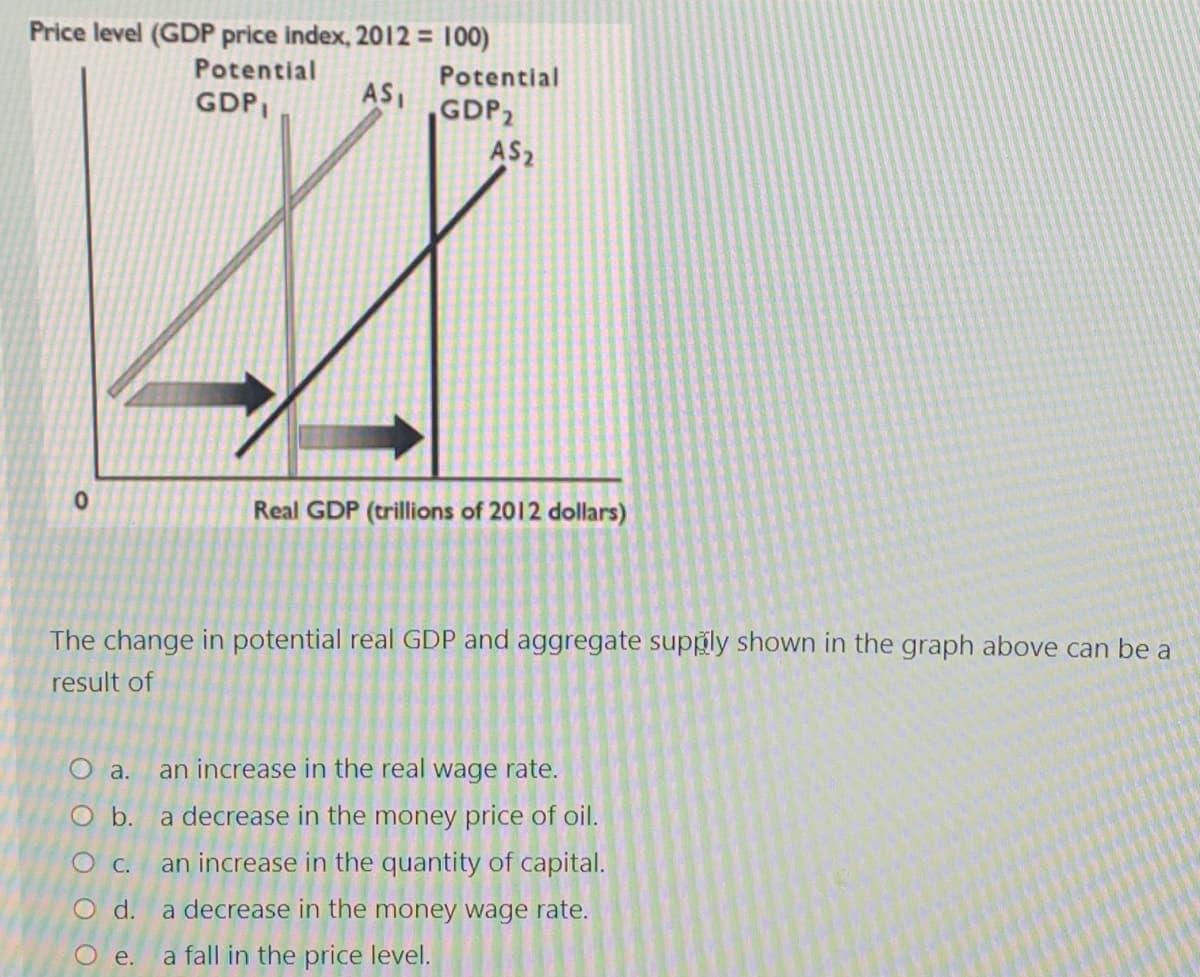
Transcribed Image Text:Price level (GDP price index, 2012 = 100)
Potential
Potential
AS,
GDP,
GDP2
AS2
Real GDP (trillions of 2012 dollars)
The change in potential real GDP and aggregate supply shown in the graph above can be a
result of
an increase in the real wage rate.
O a.
O b.
a decrease in the money price of oil.
OC.
an increase in the quantity of capital.
O d.
a decrease in the money wage rate.
e.
a fall in the price level.
Expert Solution
This question has been solved!
Explore an expertly crafted, step-by-step solution for a thorough understanding of key concepts.

This is a popular solution!

Trending now
This is a popular solution!

Step by step
Solved in 2 steps

Knowledge Booster


Learn more about
Need a deep-dive on the concept behind this application? Look no further. Learn more about this topic, economics and related others by exploring similar questions and additional content below.Recommended textbooks for you


Economics (MindTap Course List)
Economics
ISBN:
9781337617383
Author:
Roger A. Arnold
Publisher:
Cengage Learning
Economics (MindTap Course List)
Economics
ISBN:
9781337617383
Author:
Roger A. Arnold
Publisher:
Cengage Learning


Economics Today and Tomorrow, Student Edition
Economics
ISBN:
9780078747663
Author:
McGraw-Hill
Publisher:
Glencoe/McGraw-Hill School Pub Co