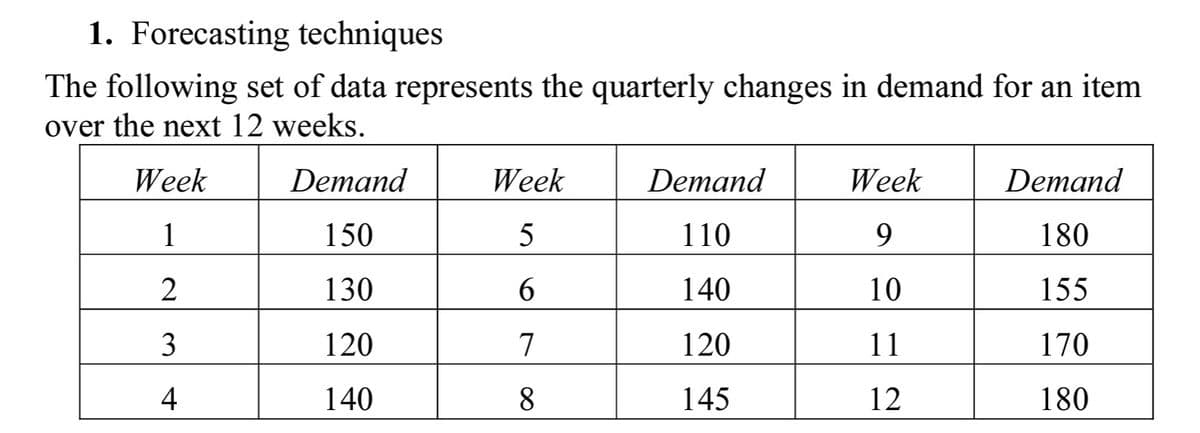
pply the moving average with base m=4 forecasting technique of the data to estimate the demand in wee


Q: snip
A: The Delphi method is more qualitative. The Delphi method was developed by the Rank corporation in…
Q: When forecasting demand for new products, sometimes i rms will use demand data from similar existing…
A: Demand forecasting is the technique used by managers to forecast the expected future demand and…
Q: Using a 3 period moving average, what is the forecast for day 8?
A: 3 period moving average is a forecasting model which helps to identify the forecast as the average…
Q: b) The forecast for the next month (Jan) using the naive method = sales (round your response to a…
A: Below is the solution:-
Q: Apply the Regression model forecasting technique of the data to estimate the demand in week 13.
A: Regression analysis is the estimation of associations between a dependent variable and one or more…
Q: Give three example of unethical conduct involving forecasting and the ethical principle each…
A: Deceptive conduct is an activity that falls outside of what is considered ethically right or…
Q: What type of forecast model would be most appropriate for a company that was introducing a new…
A: Forecast model:A forecast model is a mathematical model used to forecast future demand for a…
Q: (a) Compute a weighted average forecast for the data listed below using a weight of 0.40 for the…
A:
Q: forecast for weeks 7-24 using 6 week weighted moving average
A: Weighted moving average is a forecasting model which helps to identify the forecasting using the…
Q: A company wants to produce a weighted moving average forecast for April with the weights 0.40, 0.35,…
A: Forecasting is a method of predicting future trends, based on historical data.
Q: In order to increase the responsiveness (volatility) of following forecast models, what can you do?…
A: In order to increase the responsiveness of the forecast model using exponential smoothing, we need…
Q: The forecast for week 13 is (Enter your response rounded to the nearest whole number.)
A: Forecasting is the process of prediction in which sales demand is estimated using historic…
Q: Clinic administrator Dana Schniederjans wants you to forecast patient numbers at the clinic for week…
A: Forecasting is a process that uses recorded data as inputs to make informed estimates that are…
Q: Using trend-adjusted exponential smoothing, Forecasts (F₂), Trend (T₂), and Forecasts Including…
A: Forecasting is a technique used to predict future outcomes on the basis of past data. In businesses…
Q: Calculate the forecast for Week 16 using - a 2-period moving average - a 3-period moving average…
A: Given data is
Q: Which qualitative forecasting technique was developed to ensure that the input from every…
A: Delphi method.
Q: Explain what are the benefits of exponential smoothing over moving average forecasting
A: The table below gives a prediction of the advantages of moving average over exponential smoothing.
Q: Daily high temperatures in St. Louis for the last week were as follows: 93, 94, 93, 95, 96, 88, 90…
A:
Q: At the ABC Floral Shop, an argument developed between two of the owners, Bob and Henry, over the…
A: A simple exponential smoothing method is used for smoothing time series data by assigning…
Q: Given is a historical time series for job services demand in the prior 6 months. Month Demand 1…
A: The weighted average is a forecasting method in which higher weight is given to the most recent data…
Q: orecast demand for each week, including week 10, using exponential smoothing with a 5 .5 (initial…
A: Exponential smoothing is forecasting method which identifying the farecasting value based on the…
Q: Storrs Cycles has just started selling the new Cyclone mountain bike, with monthly sales as shown in…
A: Since you have posted a question with multiple sub-parts, we will solve the first three subparts for…
Q: Sunrise is planning its purchases of ingredients for bread production. If bread demand had been…
A: Exponential smoothing could be a statistic statement technique for univariate information that may…
Q: Predict the forecast for week 35 using an exponential smoothing with a smoothing constant of 0.20.
A: Forecasting is the process of prediction in which sales demand is estimated using historic…
Q: Explain the term forecasting with least squares
A: Forecasting is a way of making a broader basis about the coming supported by facts. It can be used…
Q: I got super lost on this one, the correct answers are shown but not how they solved or got to the…
A: Formula: Answer:
Q: Give three examples of unethical conduct involving forecasting and the ethical principle each…
A: Forecasting is the planning process that helps to predict the future demand using present or past…
Q: Forecasting Historical records show the past ten Hood Lacrosse games having the following…
A: Forecasting is the process of prediction in which sales demand is estimated using historic…
Q: What are the issues associated with qualitative forecasting, and how are these overcome? Provide…
A: Qualitative forecasting is a strategy for making forecasts about an organization's funds that…
Q: Forecast bias is useful to determine a. Seasonality b. Trends c. if forecast error is…
A: A forecast bias happens when there are differences between actual outcomes and previously generated…
Q: exponential smoothing superior to moving averages
A: Remarkable smoothing is a general guideline method for smoothing time arrangement information…
Q: Forecast is calculating estimates of future cycle/s based on data of past cycles, there is no…
A: Forecasting is the way toward making expectations dependent on over a significant time span…
Q: What three methods are used to determine the accuracy of any given forecasting method? How would you…
A: Forecasting is the process of making assumptions of future events based on past and present…
Q: An example of the Quantitative Method of forecasting is
A: Businesses and salespeople can use quantitative forecasting, an objective, data-based process, to…
Q: Assume that you have three forecasting models. For the first, MAD = 2.5, for the second, the MSE…
A: Answer : OPTION D ( One cannot conclude )
Q: Forecast is calculating estimates of future cycle/s based on data of past cycles -- there is no…
A: Forecasting is a prediction method that can use historical data and current market trends and…
Q: Explain how do exponential smoothing have benefits over shifting averages as forecasting tool
A: The merits of autoregressive moving as a prediction approach are considerable in comparison to…
Q: what is the advantage of using double exponential smoothing over regression?
A: You can use both double exponential smoothing and regression to forecast a demand pattern with a…
Q: The following set of data represents the quarterly changes in demand for an item over the next 3…
A: When determining the direction of future trends, forecasting is a technique that makes educated…
Q: How much does the forecasting process at Deckers correspond with the “typical forecasting process”…
A: Forecasting is the tool which uses the historical data as the inputs to make the informed estimates…
Q: Given the actual demand of 300, the previous forecast of 300, and an alpha of 0.048 , which one of…
A: The actual demand =300 The previous forecast = 300 Alpha = 0.048
Q: A)- Explain the calculation method for the Naive Forecast model. B) If at the end of every month…
A: Forecasting the values in advance helps to reduce the cost, and increase profits by reducing wastage…
Q: Forecast sales for the 11th period. For leveling, use exponential smoothing 0.20 and moving average…
A: Use exponential formula = α×Actual demand+(1-α)×previous demand
Q: 1. It has been said that forecasting using exponential smoothing is like driving a car by looking in…
A: As specified, I have solved the second question for you. Kindly find it's answer ahead and post the…
Q: October 5 a) Forecast the demand for the week of October 12 using a 3-week moving average. b) Use a…
A:
Q: Jim's department at a local department store has tracked the sales of a product over the last five…
A: This question is related to the topic - Forecasting approach and this topic fall under The…
Q: Explain the advantages of forecasting tool does exponential smoothing over moving avarages ?
A: The key benefits of exponential smoothing versus moving averages as a forecast.
Apply the moving average with base m=4

Step by step
Solved in 2 steps

- The file P13_42.xlsx contains monthly data on consumer revolving credit (in millions of dollars) through credit unions. a. Use these data to forecast consumer revolving credit through credit unions for the next 12 months. Do it in two ways. First, fit an exponential trend to the series. Second, use Holts method with optimized smoothing constants. b. Which of these two methods appears to provide the best forecasts? Answer by comparing their MAPE values.The file P13_22.xlsx contains total monthly U.S. retail sales data. While holding out the final six months of observations for validation purposes, use the method of moving averages with a carefully chosen span to forecast U.S. retail sales in the next year. Comment on the performance of your model. What makes this time series more challenging to forecast?The Baker Company wants to develop a budget to predict how overhead costs vary with activity levels. Management is trying to decide whether direct labor hours (DLH) or units produced is the better measure of activity for the firm. Monthly data for the preceding 24 months appear in the file P13_40.xlsx. Use regression analysis to determine which measure, DLH or Units (or both), should be used for the budget. How would the regression equation be used to obtain the budget for the firms overhead costs?
- The file P13_02.xlsx contains five years of monthly data on sales (number of units sold) for a particular company. The company suspects that except for random noise, its sales are growing by a constant percentage each month and will continue to do so for at least the near future. a. Explain briefly whether the plot of the series visually supports the companys suspicion. b. By what percentage are sales increasing each month? c. What is the MAPE for the forecast model in part b? In words, what does it measure? Considering its magnitude, does the model seem to be doing a good job? d. In words, how does the model make forecasts for future months? Specifically, given the forecast value for the last month in the data set, what simple arithmetic could you use to obtain forecasts for the next few months?The file P13_26.xlsx contains the monthly number of airline tickets sold by the CareFree Travel Agency. a. Create a time series chart of the data. Based on what you see, which of the exponential smoothing models do you think will provide the best forecasting model? Why? b. Use simple exponential smoothing to forecast these data, using a smoothing constant of 0.1. c. Repeat part b, but search for the smoothing constant that makes RMSE as small as possible. Does it make much of an improvement over the model in part b?The file P13_29.xlsx contains monthly time series data for total U.S. retail sales of building materials (which includes retail sales of building materials, hardware and garden supply stores, and mobile home dealers). a. Is seasonality present in these data? If so, characterize the seasonality pattern. b. Use Winters method to forecast this series with smoothing constants = = 0.1 and = 0.3. Does the forecast series seem to track the seasonal pattern well? What are your forecasts for the next 12 months?
- The file P13_28.xlsx contains monthly retail sales of U.S. liquor stores. a. Is seasonality present in these data? If so, characterize the seasonality pattern. b. Use Winters method to forecast this series with smoothing constants = = 0.1 and = 0.3. Does the forecast series seem to track the seasonal pattern well? What are your forecasts for the next 12 months?Under what conditions might a firm use multiple forecasting methods?The owner of a restaurant in Bloomington, Indiana, has recorded sales data for the past 19 years. He has also recorded data on potentially relevant variables. The data are listed in the file P13_17.xlsx. a. Estimate a simple regression equation involving annual sales (the dependent variable) and the size of the population residing within 10 miles of the restaurant (the explanatory variable). Interpret R-square for this regression. b. Add another explanatory variableannual advertising expendituresto the regression equation in part a. Estimate and interpret this expanded equation. How does the R-square value for this multiple regression equation compare to that of the simple regression equation estimated in part a? Explain any difference between the two R-square values. How can you use the adjusted R-squares for a comparison of the two equations? c. Add one more explanatory variable to the multiple regression equation estimated in part b. In particular, estimate and interpret the coefficients of a multiple regression equation that includes the previous years advertising expenditure. How does the inclusion of this third explanatory variable affect the R-square, compared to the corresponding values for the equation of part b? Explain any changes in this value. What does the adjusted R-square for the new equation tell you?
- The file P13_25.xlsx contains the quarterly numbers of applications for home mortgage loans at a branch office of Northern Central Bank. a. Create a time series chart of the data. Based on what you see, which of the exponential smoothing models do you think will provide the best forecasting model? Why? b. Use simple exponential smoothing to forecast these data, using a smoothing constant of 0.1. c. Repeat part b, but search for the smoothing constant that makes RMSE as small as possible. Does it make much of an improvement over the model in part b? Is it guaranteed to produce better forecasts for the future?The file P13_19.xlsx contains the weekly sales of a particular brand of paper towels at a supermarket for a one-year period. a. Using a span of 3, forecast the sales of this product for the next 10 weeks with the moving averages method. How well does this method with span 3 forecast the known observations in this series? b. Repeat part a with a span of 10. c. Which of these two spans appears to be more appropriate? Justify your choice.The file P13_27.xlsx contains yearly data on the proportion of Americans under the age of 18 living below the poverty level. a. Create a time series chart of the data. Based on what you see, which of the exponential smoothing models do you think will provide the best forecasting model? Why? b. Use simple exponential smoothing to forecast these data, using a smoothing constant of 0.1. c. Repeat part b, but search for the smoothing constant that makes RMSE as small as possible. Create a chart of the series with the forecasts superimposed from this optimal smoothing constant. Does it make much of an improvement over the model in part b? d. Write a short report to summarize your results. Considering the chart in part c, would you say the forecasts are good?

