PR 17-18 Horizontal analysis of income statement For 2014, Macklin Inc. reported its most significant increase in net income in years. At the end of the year, John Mayer, the president, is presented with the following condensed comparative income statement: OBJ. 1 V1. Net sales, 30.0% increase PREADSHEE GINERALLED Macklin Inc. Comparative Income Statement For the Years Ended December 31, 2014 and 2013 2014 2013 $936,000 26,000 $910,000 Sales. Sales returns and allowances.. Net sales... Cost of goods sold... Gross profit.. Selling expenses Administrative expenses.. Total operating expenses. Income from operations. Other income.. $720,000 20,000 $700,000 350,000 441,000 $469.000 $ 139,150 99,450 $238,600 $230,400 65.000 $295,400 65,000 $230,400 $350,000 $115,000 85,000 $200,000 $150,000 50,000 $200,000 Income before income tax Income tax expense. 50,000 $150,000 Net income. Instructions 1. Prepare a comparative income statement with horizontal analysis for the two-year period, using 2013 as the base year. Round to one decimal place. To the extent the data permit, comment on the significant relationships re- vealed by the horizontal analysis prepared in (1). 2.
PR 17-18 Horizontal analysis of income statement For 2014, Macklin Inc. reported its most significant increase in net income in years. At the end of the year, John Mayer, the president, is presented with the following condensed comparative income statement: OBJ. 1 V1. Net sales, 30.0% increase PREADSHEE GINERALLED Macklin Inc. Comparative Income Statement For the Years Ended December 31, 2014 and 2013 2014 2013 $936,000 26,000 $910,000 Sales. Sales returns and allowances.. Net sales... Cost of goods sold... Gross profit.. Selling expenses Administrative expenses.. Total operating expenses. Income from operations. Other income.. $720,000 20,000 $700,000 350,000 441,000 $469.000 $ 139,150 99,450 $238,600 $230,400 65.000 $295,400 65,000 $230,400 $350,000 $115,000 85,000 $200,000 $150,000 50,000 $200,000 Income before income tax Income tax expense. 50,000 $150,000 Net income. Instructions 1. Prepare a comparative income statement with horizontal analysis for the two-year period, using 2013 as the base year. Round to one decimal place. To the extent the data permit, comment on the significant relationships re- vealed by the horizontal analysis prepared in (1). 2.

Chapter5: Operating Activities: Purchases And Cash Payments
Section: Chapter Questions
Problem 2.1C

Related questions
Question
Transcribed Image Text:Content
Bb 2193517
+
i learn-us-east-1-prod-fleet02-xythos.content.blackboardcdn.com/5f7ce11c673e5/2193517?X-Blackboard-Expiration=1648004400000&X-Blackboard-Signature=JN20DGrMNpdS8d1. A *
* O
w WordCounter - Co...
y! Yahoo
A Regions Bank | Che..
Welcome, Justin – B.
* eBooks, Textbooks...
O Jefferson State Co...
Electronics, Cars, Fa.
C Home | Chegg.com
2193517
1 / 1
|
100%
+ |
826
Chapter 17 Financial Statement Analysis
Problems Series B
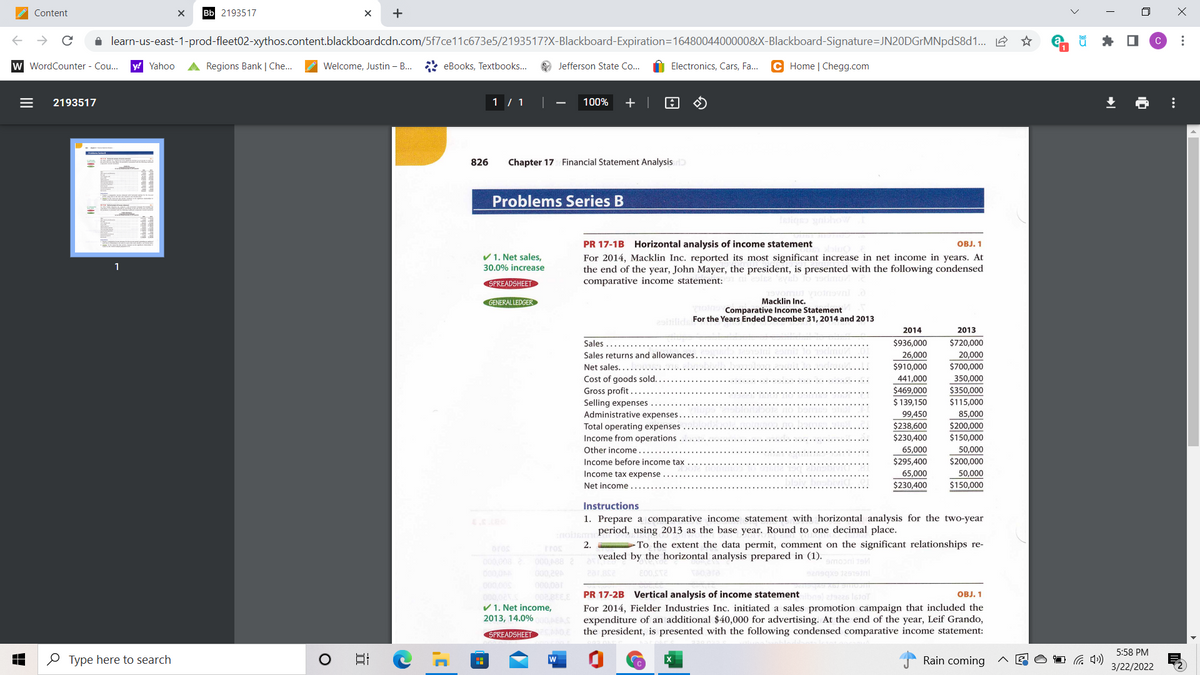
PR 17-1B Horizontal analysis of income statement
ов. 1
V 1. Net sales,
30.0% increase
For 2014, Macklin Inc. reported its most significant increase in net income in years. At
the end of the year, John Mayer, the president, is presented with the following condensed
comparative income statement:
1
SPREADSHEET
Macklin Inc.
Comparative Income Statement
2itilid For the Years Ended December 31, 2014 and 2013
GENERALLEDGER
2014
2013
Sales .....
$936,000
$720,000
Sales returns and allowances
26,000
20,000
Net sales.....
$910,000
$700,000
350,000
441,000
Cost of goods sold.
Gross profit ...
Selling expenses....
$350,000
$115,000
$469,000
$ 139,150
Administrative expenses
99,450
85,000
Total operating expenses
Income from operations
$200,000
$150,000
$238,600
$230,400
Other income
65,000
50,000
Income before income tax
$295,400
$200,000
Income tax expense
65,000
50,000
Net income
$230,400
$150,000
Instructions
1. Prepare a comparative income statement with horizontal analysis for the two-year
period, using 2013 as the base year. Round to one decimal place.
To the extent the data permit, comment on the significant relationships re-
vealed by the horizontal analysis prepared in (1).
2.
oros
Tros
000 88 2
amo
000,20A
000,0a1
PR 17-2B Vertical analysis of income statement
OBJ. 1
V 1. Net income,
For 2014, Fielder Industries Inc. initiated a sales promotion campaign that included the
2013, 14.0%AEAS expenditure of an additional $40,000 for advertising. At the end of the year, Leif Grando,
SPREADSHEET
the president, is presented with the following condensed comparative income statement:
5:58 PM
O Type here to search
日
Rain coming
3/22/2022
*..
...
Expert Solution
This question has been solved!
Explore an expertly crafted, step-by-step solution for a thorough understanding of key concepts.

This is a popular solution!

Trending now
This is a popular solution!

Step by step
Solved in 3 steps with 1 images

Recommended textbooks for you