Practice Exercise 1. A grade 11 student of Tabaco National High School surveyed the households in Tabaco City. The random variable X represents the number of high school students with gadgets to be used in online classes. The probability distribution of X is shown below. X 1 2 3 4 0 0.02 P(x) 0.18 0.30 0.40 0.10 Find the expected value and interpret the result.
Practice Exercise 1. A grade 11 student of Tabaco National High School surveyed the households in Tabaco City. The random variable X represents the number of high school students with gadgets to be used in online classes. The probability distribution of X is shown below. X 1 2 3 4 0 0.02 P(x) 0.18 0.30 0.40 0.10 Find the expected value and interpret the result.

MATLAB: An Introduction with Applications
6th Edition
ISBN:9781119256830
Author:Amos Gilat
Publisher:Amos Gilat
Chapter1: Starting With Matlab
Section: Chapter Questions
Problem 1P

Related questions
Question
NOTE: please follow the step in the given lesson below
Transcribed Image Text:Practice Exercise
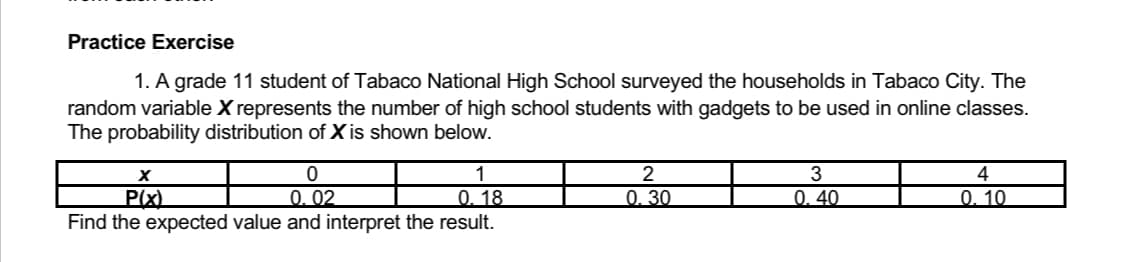
1. A grade 11 student of Tabaco National High School surveyed the households in Tabaco City. The
random variable X represents the number of high school students with gadgets to be used in online classes.
The probability distribution of X is shown below.
1
2
3
4
X
P(x)
0
0.02
0.18
0.30
0.40
0.10
Find the expected value and interpret the result.
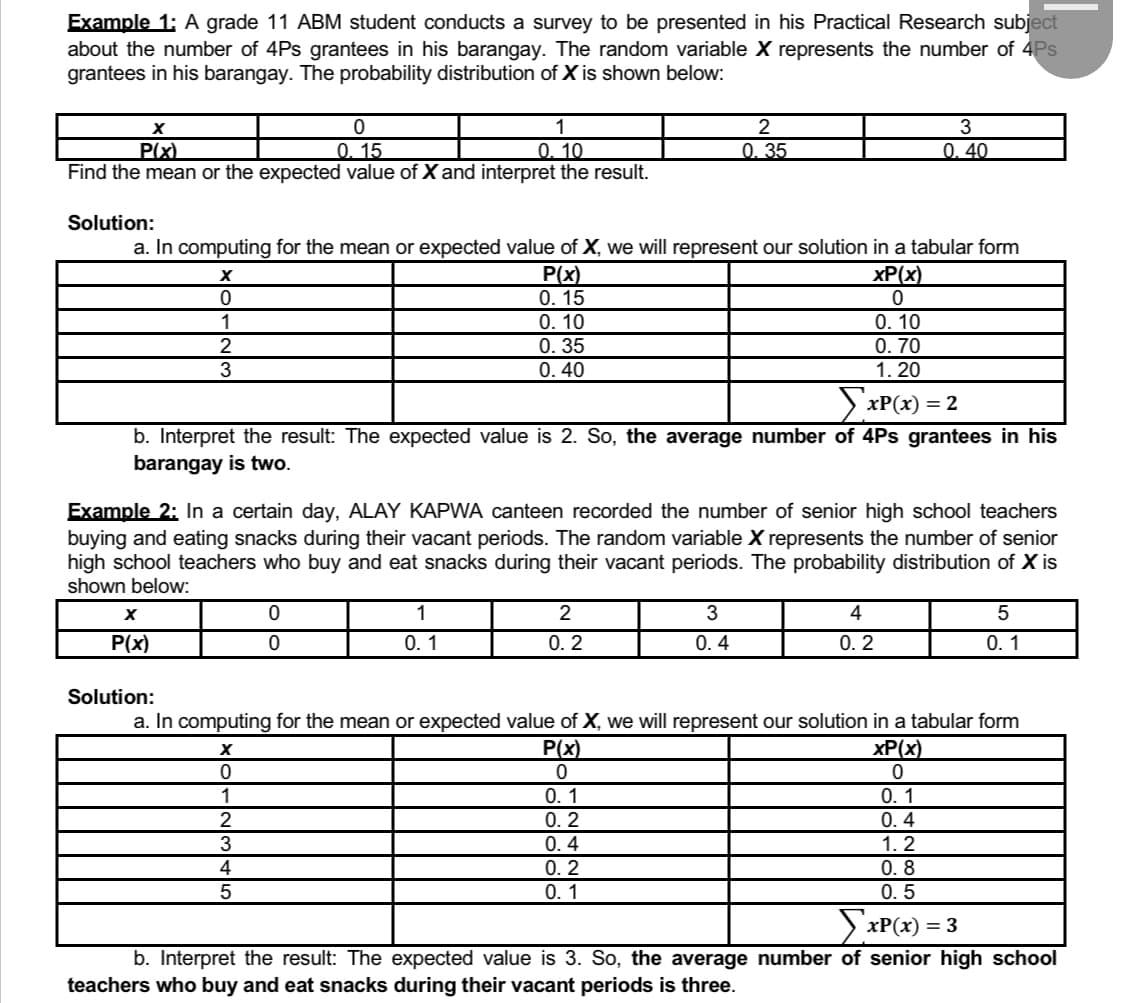
Transcribed Image Text:Example 1: A grade 11 ABM student conducts a survey to be presented in his Practical Research subject
about the number of 4Ps grantees in his barangay. The random variable X represents the number of 4Ps
grantees in his barangay. The probability distribution of X is shown below:
2
X
P(x)
0
0.15
1
0.10
3
0.40
0.35
Find the mean or the expected value of X and interpret the result.
Solution:
a. In computing for the mean or expected value of X, we will represent our solution in a tabular form
X
xP(x)
P(x)
0.15
0
0
1
0.10
2
0.35
0. 10
0.70
1. 20
3
0.40
xP(x) = 2
b. Interpret the result: The expected value is 2. So, the average number of 4Ps grantees in his
barangay is two.
Example 2: In a certain day, ALAY KAPWA canteen recorded the number of senior high school teachers
buying and eating snacks during their vacant periods. The random variable X represents the number of senior
high school teachers who buy and eat snacks during their vacant periods. The probability distribution of X is
shown below:
X
0
1
2
3
4
5
P(x)
0
0. 1
0.2
0.4
0.2
0. 1
Solution:
a. In computing for the mean or expected value of X, we will represent our solution in a tabular form
X
xP(x)
P(x)
0
0
0
1
0.1
0.1
2
0.2
0.4
3
0.4
1.2
4
0.2
0.8
5
0.1
0.5
ΣxP(x) = 3
b. Interpret the result: The expected value is 3. So, the average number of senior high school
teachers who buy and eat snacks during their vacant periods is three.
Expert Solution
This question has been solved!
Explore an expertly crafted, step-by-step solution for a thorough understanding of key concepts.

Step by step
Solved in 3 steps

Recommended textbooks for you
MATLAB: An Introduction with Applications
Statistics
ISBN:
9781119256830
Author:
Amos Gilat
Publisher:
John Wiley & Sons Inc

Probability and Statistics for Engineering and th…
Statistics
ISBN:
9781305251809
Author:
Jay L. Devore
Publisher:
Cengage Learning

Statistics for The Behavioral Sciences (MindTap C…
Statistics
ISBN:
9781305504912
Author:
Frederick J Gravetter, Larry B. Wallnau
Publisher:
Cengage Learning
MATLAB: An Introduction with Applications
Statistics
ISBN:
9781119256830
Author:
Amos Gilat
Publisher:
John Wiley & Sons Inc
Probability and Statistics for Engineering and th…
Statistics
ISBN:
9781305251809
Author:
Jay L. Devore
Publisher:
Cengage Learning
Statistics for The Behavioral Sciences (MindTap C…
Statistics
ISBN:
9781305504912
Author:
Frederick J Gravetter, Larry B. Wallnau
Publisher:
Cengage Learning

Elementary Statistics: Picturing the World (7th E…
Statistics
ISBN:
9780134683416
Author:
Ron Larson, Betsy Farber
Publisher:
PEARSON

The Basic Practice of Statistics
Statistics
ISBN:
9781319042578
Author:
David S. Moore, William I. Notz, Michael A. Fligner
Publisher:
W. H. Freeman

Introduction to the Practice of Statistics
Statistics
ISBN:
9781319013387
Author:
David S. Moore, George P. McCabe, Bruce A. Craig
Publisher:
W. H. Freeman