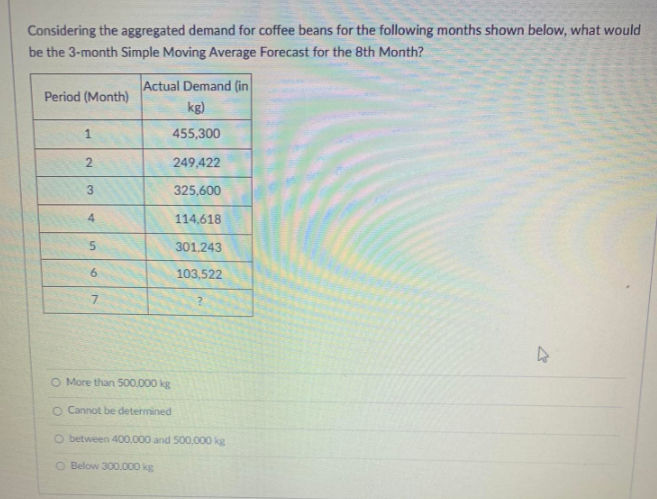
Considering the aggregated demand for coffee beans for the following months shown below, what would be the 3-month Simple Moving Average Forecast for the 8th Month? Actual Demand (in Period (Month) kg) 1 455,300 2 249,422 325,600 114,618 301,243 103,522 ? 4 3 4 5 6 7 O More than 500,000 kg O Cannot be determined O between 400,000 and 500,000 kg O Below 300,000 kg
Q: The stem-and-leaf plot shows house sale prices over the last week in Tacoma. The stem is in hundreds…
A: In the stem-and-leaf plot, the data is arranged in ascending order.
Q: Evaluate the polynomial function for the given values of the variable. P(v) = 4v²-18v+2: find P(4)…
A: Given : p(v) = 4v2 -18v + 2
Q: The probability that a person stopping at a gas station will ask to have his tires checked is 0.12,…
A: Given data isThe probability that a person stopping at a gas station will ask to have his tires…
Q: Here is a bivariate data set. X y 15 16.1 29.4 76.5 14.9 -153.4 23.6 20.4 21.5 136.8 8.1 117.5 13…
A: Here data is given, We have to calculate correlation coefficient for the data. Correlation…
Q: Find the indicated area. Find the area of the indicated region under the standard normal curve.…
A: Given data is
Q: Of 500 workers employed in a nuclear power plant in the last 20 years, 12 during that time. An…
A: Given data,No of workers n=500Contracted cancer during that time is x=12Proportion is…
Q: Run a regression analysis on the following bivariate set of data with y as the response variable. X…
A: "Since you have posted a question with multiple subparts, we will solve first 3 sub-parts for you.…
Q: X₁, X2,...,xn is a random sample from the population that follows a Poisson distribution with the…
A: Given information: Given x1, x2, x3,................... xnis a random sample from the population…
Q: Let the random variable X have the moment generating function e³t M(t) = 1-t²-1<t<1 What are the…
A:
Q: tion with 2 degrees of freedom. Find hree decimal places.
A: It is given that the t distribution with 2 degrees of freedom. We have to find c such that P(-c <…
Q: D5) Statistics and Probability A plant manager is considering investing in a new $40,000 machine.…
A: Given information: Investment amount = $40,000 Expected cash flow = $9,000 Actual cash…
Q: Before the start of a student retention program against student desertion in a city metropolitan…
A: From the given information, x=250 and n=600.
Q: Let x be a continuous random variable that is normally distributed with mean μ = 27 and standard…
A: GivenMean(μ)=27standard deviation(σ)=4
Q: How can we use Statistics and Probability to help others make informed decisions regarding Diet and…
A:
Q: USA Today reports that the average expenditure on Valentine's Day was expected to be $100.89. Do…
A:
Q: An advertising agency collected a random sample of 300 businesses targeted with an advertising…
A:
Q: a) Consider a t distribution with 11 degrees of freedom. Compute P(-1.03 <t<1.03). Round your answer…
A: a) Given data : Degree of freedom, df = 11
Q: Suppose that, for events A and B, P(A)= 0.2, P(B)= 0.85, and P(AandB)= 0.17. (i) Calculate the…
A:
Q: probability Find the mean of x. vailable is P(x) = (3Cx)(¹/4)*(3/4)³* for x = 0,1,2,3
A: It is given that the probability distribution of discrete random variable X follows Binomial…
Q: Consider the following claim. Ho : p =10 H : μ > 10 Use the following information: n = 24, X = 12.7,…
A: a) Given data : sample size, n =24 sample mean, x̄ = 12.7 sample standard…
Q: THE DICE IS THROWN 180 TIMES, THE PROBABILITY THAT THE NUMBER 6 APPEARS FROM 40 TO 45 IS 0.1359,…
A: Given that ; Sample size (n) = 180 A dice is thrown then probability of 6 is appear = 1/ 6 By using…
Q: COVID-19 (novel corona virus) took the world by surprise in late 2019. By early 2020, nearly all…
A: Sample size(n)=1445 Number of asymptomatic patients(x)=275
Q: An advertising agency collected a random sample of 300 businesses targeted with an advertising…
A: The population is the entire group about which the sample is taken. The sample is a subset of the…
Q: 1. Type of test statistic: a. Z b. t c. Chi-Square d. F Degrees of freedom (if applicable)
A: The choice of correct inferential procedure is dependent on several conditions.
Q: Suppose that a random sample of 16 adult U.S. males has a mean height of 70 inches with a standard…
A: Given : Sample Size, n = 16 Sample Mean, x̄ = 70 sample standard…
Q: Question 14: You wish to test the following claim (HaHa) at a significance level of α=0.01α=0.01.…
A: According to the given information in this question We need to apply z test for one population…
Q: Question 18: Let YY represent the profit (or loss) for a certain company XX years after 1960. Based…
A: Given :
Q: tion 16: According to a University Center for Logistics Management, 4% of all merchandise sold in…
A: Given data,Population proportion is p=4%=0.04Sample Proportion is P' =589=0.0562Test statistic z=?
Q: Indicate whether or not the first researcher’s position is supported by the results.
A: here given , Angel believes a coin is “fair,” the other believes the coin is biased toward heads.…
Q: 10.P(Z<0.11)=_
A: We will use Standard Normal table to find the required probability.
Q: computer software package was used to calculate some numerical summaries of a sample of data results…
A: From the provided information, Standard error (SE) of mean = 2.05 Standard deviation = 10.25 Sum =…
Q: Can smoking negatively affect one's ability to become pregnant? A study collected data on 654 women…
A: Given, Smoker Non-smoker Total Pregnant 27 195 222 Not pregnant 100…
Q: H. Find the expected value of Z = (X2 + y2)₂. Let X and Y be random variables with joint density…
A: X and Y are random variables with joint density function given by fx,y=4xy 0<x,y<1
Q: Find the area under the standard normal curve to the left of z = 1.5. 0.5199 0.7612 0.9332 0.0668
A:
Q: Column A 1. Population Mean Symbol 2. Population Variance formula 3. Standard Deviation of Ungrouped…
A: from the given data
Q: A federal regulatory agency is investigating an advertised claim that a certain device can increase…
A: Given : Mean(before) =23.22 Mean(after)=25.33 Mean difference =-2.11 s(change) =7.54 n=10
Q: Point estimation surrounds the interval estimates with a margin of error to create a range of values…
A: here use Interval estimate and point estimate of population parameter point estimate is particular…
Q: n uses simple exponential smoothing with trend adjustment to forecast dema 0.4" and "=0.3". The…
A:
Q: Cami plays softball. The table to the right shows the frequency of the number of hits she has per…
A: The table is given as below Number of hits Frequency 0 10 1 19 2 9 3 6 4 2
Q: Studies indicate that excessive noise at night can affect weight gain. One study of n = 127 rats…
A:
Q: A subspecies of the Bar-tailed godwit (Limosa lapponica baueri) is a large, long-billed, long-legged…
A: Given that A subspecies of the Bar-tailed godwit (Limosa lapponica baueri) is a large, long-billed,…
Q: Question 25: Here is a bivariate data set. x y 75.2 37
A: Given that Following Data for X & Y respectively :
Q: A consumer organization wants to estimate the actual tread wear index of a brand name of tires that…
A:
Q: Paul applies to sell souvenirs at a sporting event. He may be assigned to any of sections A through…
A: Hi, As your question has more than 3 parts, as per the policy, we have solved only the first three…
Q: X₁ + X₂ Q2: Let X₁-G(4,3) and X₂G(2,3) by mgf find dist. of Y=X₁ +X₂. ===
A:
Q: These are the selections for the drop down boxes in parenthesis. The hypothesis test will be…
A: Solution Given test is based on the one sample proportion test.
Q: -(x-8) x > 0 e. w. ' Q3: Let X₁, X₂, ..., Xn ~ f(x; 0) = f(x; 0) = {e-(x-6) a) Find the MLE of 0. b)…
A:
Q: Two independent samples are taken from two populations. Sample 1 has a mean of 12.8 standard…
A: It is given that sample means are 12.8 and 14.2.
Q: What does it mean if a percentage is higher than Benford's law percentage. Can you give me a…
A: Given information: First digit Observed proportion Percent of total 1 30.10% 36.67% 2 17.60%…
Q: INSTRUCTION: Ask the ages of your 10 relatives parents, siblings, cousins, aunt, uncle and the…
A: The following sample data ( ages of relatives) has been provided: 47, 46 , 24, 17 , 9, 1, 11, 25, 7…
Step by step
Solved in 2 steps with 1 images
- Given the following data for demand at the XYZ Company, calculate the monthly forecast for 2003 using a 3-month moving average. Calculate the Forecast, Error, MAD (mean absolute percentage error), Bias and the TS (tracking signal) .Metropolitan Hospital has estimated its average monthly bed needs, N, as: N=460+9X�=460+9� where X = time period (months); (January 2002 = 0) Assume that no new hospital additions are expected in the area in the foreseeable future. The following monthly seasonal adjustment factors have been estimated, using data from the past five years: Forecast Metropolitan's bed demand for January, April, July, November, and December 2007. Month Adjustment Factor (%) Forecast January +5 April -15 July +4 November -5 December -25 Suppose the following actual and forecast values for June bed demands have been recorded. Year Forecast Actual 2007 1,045 1,139 2006 937 974 2005 829 895 2004 721 743 2003 613 656 2002 505 515 What seasonal adjustment factor would you recommend be used in making future June forecasts? 2.1% 5.5% 1.3%The problem is based on the following data given. Observations of the demand for a certain part stocked at a parts supply depot during the calendar year 2013 were ( as shown ). Using a four-month moving average, determine the two-step-ahead forecast for July through December 2013. (Hint: The two-step-ahead forecast for July is based on the observed demands in February through May.)
- Price information for selected foods for 2010 and 2018 is given in the table. Price Quantity Item 2010 2018 2010 2018 Cabbage (pound) $ 0.06 $ 0.05 2,000 1,500 Carrots (bunch) 0.10 0.12 200 200 Peas (quart) 0.20 0.18 400 500 Endive (bunch) 0.15 0.15 100 200 Compute a simple price index for each of the four items. Use 2010 as the base period. (Round your answers to 2 decimal places.)Given the following demand for ten-period time frame as shown in the table below. Compute the three-period and five-period moving average forecasts. Plot the actual demand and the forecasts on the same graph. Period 1 2 3 4 5 6 7 8 9 10 Demand (in units) 24 25 28 32 35 38 41 46 49 53 Forecast Table: Period Actual 3-Moving Averages 5-Moving Averages 1 24 2 25 3 28 4 32 5 35 6 38 7 41 8 46 9 49 10 53 11Given the following data and seasonal index: Month Sales Year 1 Year 2 Jan 8 8 Feb 7 9 Mar 5 6 Apr 10 11 May 9 12 June 12 16 July 15 20 Aug 20 25 Sept 4 4 Oct 3 2 Nov 8 7 Dec 9 9 (a) Compute the seasonal index using only year 1 data. (b) Determine the deseasonalized demand values using year 2 data and year 1's seasonal indices.
- The accompanying dataset provides data on monthly unemployment rates for a certain region over four years. Compare 3- and 12-month moving average forecasts using the MAD criterion. Which of the two models yields better results? Explain. Find the MAD for the 3-month moving average forecast. MAD=? (Type an integer or decimal rounded to three decimal places as needed.) Year Month Rate(%) 2010 Jan 7.8 2010 Feb 8.2 2010 Mar 8.8 2010 Apr 9.1 2010 May 9.5 2010 Jun 9.3 2010 Jul 9.7 2010 Aug 9.6 2010 Sep 9.8 2010 Oct 10.1 2010 Nov 9.7 2010 Dec 9.8 2011 Jan 9.7 2011 Feb 9.9 2011 Mar 9.8 2011 Apr 9.9 2011 May 9.7 2011 Jun 9.4 2011 Jul 9.4 2011 Aug 9.3 2011 Sep 9.7 2011 Oct 9.3 2011 Nov 9.9 2011 Dec 9.5 2012 Jan 9.3 2012 Feb 8.8 2012 Mar 8.7 2012 Apr 9.1 2012 May 9.2 2012 Jun 9.2 2012 Jul 9.1 2012 Aug 9.1 2012 Sep 9.1 2012 Oct 8.9 2012 Nov 8.4 2012 Dec 8.3 2013 Jan 8.4 2013 Feb 8.1 2013 Mar 8.4 2013 Apr…The customer demand for a particular smart phone during Year 0 to Year 5 is given as 1,056,000, 1,032,000, 1,093,000, 1,024,000, 1,066,000, and 1,072,000. Using the Holt forecasting model with trend, what is the forecasted demand in year 10, where w = 0.4 and v = 0.5?a) 1,071,874b) 1,075,573c) 1,077,488d) 1,083,816A shop is planning an order for a popular Christmas festive season product. Demand for the product usually starts from first week of December till first week of January and reduces sharply thereafter. For this reason, and to stimulate sales for leftovers, the product is sold at a significantly reduced price from the second week of January to the fourth week of January. Any leftover after the fourth week of January goes waste. The table below gives past data on total demand for the period from first week of December to first week of January, and from second week of January to fourth week of January, together with their respective chances of occurrence. The product can be purchased at a wholesale price of GHS60 per unit for a pack containing 600 products, GHS57 per unit for a pack containing 800 products, and GHS52 per unit for a pack containing 1000 products. The shop plans to sell the product for GHS80 per unit from first week of December to first week of January, and at a reduced…
- A shop is planning an order for a popular Christmas festive season product. Demand for the product usually starts from first week of December till first week of January and reduces sharply thereafter. For this reason, and to stimulate sales for leftovers, the product is sold at a significantly reduced price from the second week of January to the fourth week of January. Any leftover after the fourth week of January goes waste. The table below gives past data on total demand for the period from first week of December to first week of January, and from second week of January to fourth week of January, together with their respective chances of occurrence. The product can be purchased at a wholesale price of GHS60 per unit for a pack containing 600 products, GHS57 per unit for a pack containing 800 products, and GHS52 per unit for a pack containing 1000 products. The shop plans to sell the product for GHS80 per unit from first week of December to first week of January, and at a reduced…A shop is planning an order for a popular Christmas festive season product. Demand for the product usually starts from first week of December till first week of January and reduces sharply thereafter. For this reason, and to stimulate sales for leftovers, the product is sold at a significantly reduced price from the second week of January to the fourth week of January. Any leftover after the fourth week of January goes waste. The table below gives past data on total demand for the period from first week of December to first week of January, and from second week of January to fourth week of January, together with their respective chances of occurrence. The product can be purchased at a wholesale price of GHS60 per unit for a pack containing 600 products, GHS57 per unit for a pack containing 800 products, and GHS52 per unit for a pack containing 1000 products. The shop plans to sell the product for GHS80 per unit from first week of December to first week of January, and at a reduced…The prices and the numbers of various items produced by a small machine and stamping plant are reported below. Use 2010 as the base. 2010 2018 Item Price (in $) Quantity Price (in $) Quantity Washer 0.07 17,000 0.10 20,000 Cotter pin 0.04 125,000 0.03 130,000 Stove bolt 0.15 40,000 0.15 42,000 Hex nut 0.08 62,000 0.10 65,000 a. Determine the Laspeyres price index. (Round your answer to 2 decimal places.) b. Determine the Paasche price index. (Round your answer to 2 decimal places.)