Prediction and Tolerance Interval Fifteen (15) samples of water were collected from a certain treatment facility in order to gain some insight regarding the amount of coliform in the urban pipeline. The concentration of the coliform is measured in parts per million (ppm), per liter. Suppose that the mean at the treatment facility is not as important as the upper extreme of the distribution of the amount of coliform detected. The concern is whether the concentration of coliform is too large. Readings for the 15 water samples gave a sample mean of 3.84 ppm per liter and a standard deviation of 3.07 ppm per liter. Assume that the readings are a random sample from a normal distribution. Calculate a Prediction Interval (upper 95% prediction limit) and a Tolerance Limit (95% upper tolerance limit that exceeds 95% of the population values). Interpret both; that is, tell what each communicates about the upper extreme of the distribution of coliform at the sampling in the treatment facility. O a. Prediction Upper Limit: Xn+1s 10.597. This means that a new observation will have a chance of 95% to fall below the upper limit. Tolerance Upper Limit: 11.72. Hence, we are 95% confident that a limit of 11.72 will contain 95% of the coliform measurement in the water samples O b. Prediction Upper Limit: Xn+159.424. This means that a new observation will have a chance of 95% to fall below the upper limit. Tolerance Upper Limit: 11.72. Hence, we are 95% confident that a limit of 11.72 will contain 95% of the coliform measurement in the water samples O C. Prediction Upper Limit: Xn+1 59.398. This means that a new observation will have a chance of 95% to fall below the upper limit. Tolerance Upper Limit: 11.86. Hence, we are 95% confident that a limit of 11.86 will contain 95% of the coliform measurement in the water samples O d. Prediction Upper Limit: Xn+1s10.641. This means that a new observation will have a chance of 95% to fall below the upper limit. Tolerance Upper Limit: 12.91. Hence, we are 95% confident that a limit of 12.91 will contain 95% of the coliform measurement in the water samples
Prediction and Tolerance Interval Fifteen (15) samples of water were collected from a certain treatment facility in order to gain some insight regarding the amount of coliform in the urban pipeline. The concentration of the coliform is measured in parts per million (ppm), per liter. Suppose that the mean at the treatment facility is not as important as the upper extreme of the distribution of the amount of coliform detected. The concern is whether the concentration of coliform is too large. Readings for the 15 water samples gave a sample mean of 3.84 ppm per liter and a standard deviation of 3.07 ppm per liter. Assume that the readings are a random sample from a normal distribution. Calculate a Prediction Interval (upper 95% prediction limit) and a Tolerance Limit (95% upper tolerance limit that exceeds 95% of the population values). Interpret both; that is, tell what each communicates about the upper extreme of the distribution of coliform at the sampling in the treatment facility. O a. Prediction Upper Limit: Xn+1s 10.597. This means that a new observation will have a chance of 95% to fall below the upper limit. Tolerance Upper Limit: 11.72. Hence, we are 95% confident that a limit of 11.72 will contain 95% of the coliform measurement in the water samples O b. Prediction Upper Limit: Xn+159.424. This means that a new observation will have a chance of 95% to fall below the upper limit. Tolerance Upper Limit: 11.72. Hence, we are 95% confident that a limit of 11.72 will contain 95% of the coliform measurement in the water samples O C. Prediction Upper Limit: Xn+1 59.398. This means that a new observation will have a chance of 95% to fall below the upper limit. Tolerance Upper Limit: 11.86. Hence, we are 95% confident that a limit of 11.86 will contain 95% of the coliform measurement in the water samples O d. Prediction Upper Limit: Xn+1s10.641. This means that a new observation will have a chance of 95% to fall below the upper limit. Tolerance Upper Limit: 12.91. Hence, we are 95% confident that a limit of 12.91 will contain 95% of the coliform measurement in the water samples

Big Ideas Math A Bridge To Success Algebra 1: Student Edition 2015
1st Edition
ISBN:9781680331141
Author:HOUGHTON MIFFLIN HARCOURT
Publisher:HOUGHTON MIFFLIN HARCOURT
Chapter11: Data Analysis And Displays
Section: Chapter Questions
Problem 4CT

Related questions
Question
Show complete solution
Transcribed Image Text:Prediction and Tolerance Interval
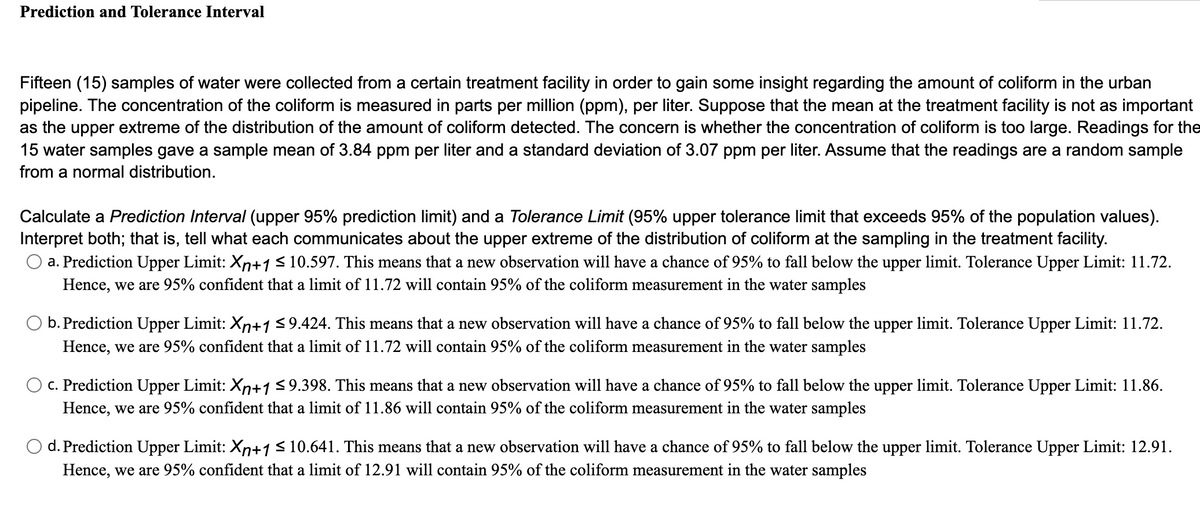
Fifteen (15) samples of water were collected from a certain treatment facility in order to gain some insight regarding the amount of coliform in the urban
pipeline. The concentration of the coliform is measured in parts per million (ppm), per liter. Suppose that the mean at the treatment facility is not as important
as the upper extreme of the distribution of the amount of coliform detected. The concern is whether the concentration of coliform is too large. Readings for the
15 water samples gave a sample mean of 3.84 ppm per liter and a standard deviation of 3.07 ppm per liter. Assume that the readings are a random sample
from a normal distribution.
Calculate a Prediction Interval (upper 95% prediction limit) and a Tolerance Limit (95% upper tolerance limit that exceeds 95% of the population values).
Interpret both; that is, tell what each communicates about the upper extreme of the distribution of coliform at the sampling in the treatment facility.
O a. Prediction Upper Limit: Xn+1< 10.597. This means that a new observation will have a chance of 95% to fall below the upper limit. Tolerance Upper Limit: 11.72.
Hence, we are 95% confident that a limit of 11.72 will contain 95% of the coliform measurement in the water samples
b. Prediction Upper Limit: Xn+1<9.424. This means that a new observation will have a chance of 95% to fall below the upper limit. Tolerance Upper Limit: 11.72.
Hence, we are 95% confident that a limit of 11.72 will contain 95% of the coliform measurement in the water samples
O c. Prediction Upper Limit: Xn+159.398. This means that a new observation will have a chance of 95% to fall below the upper limit. Tolerance Upper Limit: 11.86.
Hence, we are 95% confident that a limit of 11.86 will contain 95% of the coliform measurement in the water samples
d. Prediction Upper Limit: Xn+1<10.641. This means that a new observation will have a chance of 95% to fall below the upper limit. Tolerance Upper Limit: 12.91.
Hence, we are 95% confident that a limit of 12.91 will contain 95% of the coliform measurement in the water samples
Expert Solution
This question has been solved!
Explore an expertly crafted, step-by-step solution for a thorough understanding of key concepts.

This is a popular solution!

Trending now
This is a popular solution!

Step by step
Solved in 3 steps with 3 images

Recommended textbooks for you
Big Ideas Math A Bridge To Success Algebra 1: Stu…
Algebra
ISBN:
9781680331141
Author:
HOUGHTON MIFFLIN HARCOURT
Publisher:
Houghton Mifflin Harcourt

Glencoe Algebra 1, Student Edition, 9780079039897…
Algebra
ISBN:
9780079039897
Author:
Carter
Publisher:
McGraw Hill
Big Ideas Math A Bridge To Success Algebra 1: Stu…
Algebra
ISBN:
9781680331141
Author:
HOUGHTON MIFFLIN HARCOURT
Publisher:
Houghton Mifflin Harcourt
Glencoe Algebra 1, Student Edition, 9780079039897…
Algebra
ISBN:
9780079039897
Author:
Carter
Publisher:
McGraw Hill