Prehistoric pottery vessels are usually found as sherds (broken pieces) and are carefully reconstructed if enough sherds can be found. An archaeological study provides data relating x = body diameter in centimeters and y = height in centimeters of prehistoric vessels reconstructed from sherds found at a prehistoric site. The following Minitab printout provides an analysis of the data. Coef SE Coef Predictor T P Constant -0.242 2.429 -0.09 0.929 Diameter 0.7905 0.1471 5.57 0.001 S = R-Sq = 86.18 4.07980 (a) Minitab calls the explanatory variable the predictor variable. Which is the predictor variable, the diameter of the pot o the height? diameter O height (b) For the least-squares line ŷ = a + bx, what is the value of the constant a? What is the value of the slope b? (Note: Th slope is the coefficient of the predictor variable.) Write the equation of the least-squares line. a = -0.242 b = 0.7905 ý = -0.242 + 0.7905 (c) The P-value for a two-tailed test corresponding to each coefficient is listed under P., The t value corresponding to the coefficient is listed under T. What is the P-value of the slope? 0.001 What are the hypotheses for a two-tailed test of ß = 0? OHo: B< 0; H,: ß = 0 O Ho: B = 0; H,: ß # 0 Hoi ß = 0; H: ß < 0 O Ho: B+ 0; H,: B = 0 Ho: B = 0; Hq: ß > 0 Based on the P-value in the printout, do we reject or fail to reject the null hypothesis for a = 0.01? O Reject the null hypothesis. There is sufficient evidence that B differs from 0. Fail to reject the null hypothesis. There is insufficient evidence that ß differs from 0. O Fail to reject the null hypothesis. There is sufficient evidence that ß differs from 0. Reject the null hypothesis. There is insufficient evidence that ß differs from 0. (d) Recall that the t value and resulting P-value of the slope b equal the t value and resulting P-value of the corresponding correlation coefficient r. To find the value of the sample correlation coefficient r, take the square root of the "R-Sq" value
Prehistoric pottery vessels are usually found as sherds (broken pieces) and are carefully reconstructed if enough sherds can be found. An archaeological study provides data relating x = body diameter in centimeters and y = height in centimeters of prehistoric vessels reconstructed from sherds found at a prehistoric site. The following Minitab printout provides an analysis of the data. Coef SE Coef Predictor T P Constant -0.242 2.429 -0.09 0.929 Diameter 0.7905 0.1471 5.57 0.001 S = R-Sq = 86.18 4.07980 (a) Minitab calls the explanatory variable the predictor variable. Which is the predictor variable, the diameter of the pot o the height? diameter O height (b) For the least-squares line ŷ = a + bx, what is the value of the constant a? What is the value of the slope b? (Note: Th slope is the coefficient of the predictor variable.) Write the equation of the least-squares line. a = -0.242 b = 0.7905 ý = -0.242 + 0.7905 (c) The P-value for a two-tailed test corresponding to each coefficient is listed under P., The t value corresponding to the coefficient is listed under T. What is the P-value of the slope? 0.001 What are the hypotheses for a two-tailed test of ß = 0? OHo: B< 0; H,: ß = 0 O Ho: B = 0; H,: ß # 0 Hoi ß = 0; H: ß < 0 O Ho: B+ 0; H,: B = 0 Ho: B = 0; Hq: ß > 0 Based on the P-value in the printout, do we reject or fail to reject the null hypothesis for a = 0.01? O Reject the null hypothesis. There is sufficient evidence that B differs from 0. Fail to reject the null hypothesis. There is insufficient evidence that ß differs from 0. O Fail to reject the null hypothesis. There is sufficient evidence that ß differs from 0. Reject the null hypothesis. There is insufficient evidence that ß differs from 0. (d) Recall that the t value and resulting P-value of the slope b equal the t value and resulting P-value of the corresponding correlation coefficient r. To find the value of the sample correlation coefficient r, take the square root of the "R-Sq" value

Algebra & Trigonometry with Analytic Geometry
13th Edition
ISBN:9781133382119
Author:Swokowski
Publisher:Swokowski
Chapter3: Functions And Graphs
Section3.3: Lines
Problem 76E

Related questions
Question
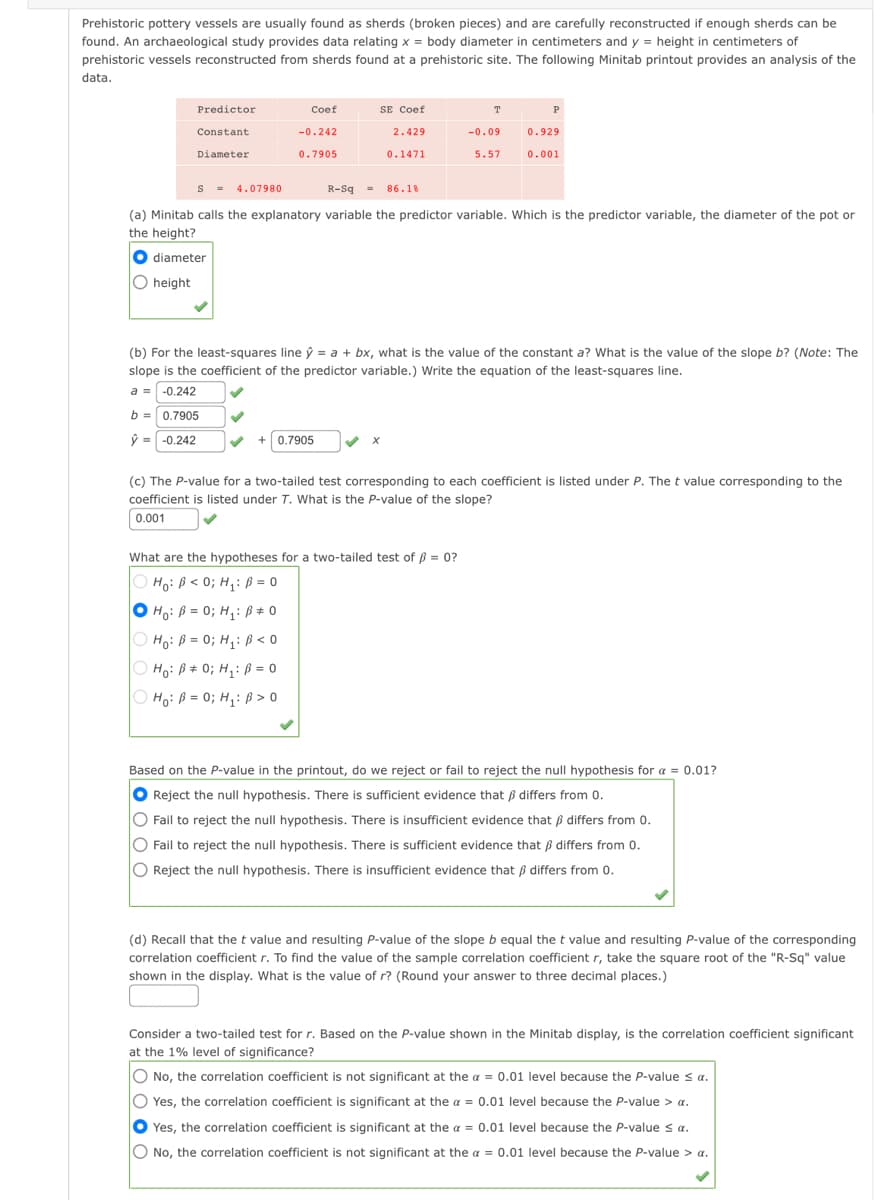
Transcribed Image Text:Prehistoric pottery vessels are usually found as sherds (broken pieces) and are carefully reconstructed if enough sherds can be
found. An archaeological study provides data relating x = body diameter in centimeters and y = height in centimeters of
prehistoric vessels reconstructed from sherds found at a prehistoric site. The following Minitab printout provides an analysis of the
data.
SE Coef
Predictor
Coef
T
P
Constant
-0.242
2.429
-0.09
0.929
Diameter
0.7905
0.1471
5.57
0.001
S = 4.07980
R-Sq = 86.1%
(a) Minitab calls the explanatory variable the predictor variable. Which is the predictor variable, the diameter of the pot or
the height?
O diameter
O height
(b) For the least-squares line ý = a + bx, what is the value of the constant a? What is the value of the slope b? (Note: The
slope is the coefficient of the predictor variable.) Write the equation of the least-squares line.
a = -0.242
b =0.7905
ý = -0.242
+0.7905
(c) The P-value for a two-tailed test corresponding to each coefficient is listed under P. The t value corresponding to the
coefficient is listed under T. What is the P-value of the slope?
0.001
What are the hypotheses for a two-tailed test of ß = 0?
Ho: ß < 0; H,: ß = 0
O Ho: B = 0; H,: Bß# 0
O Hoi ß = 0; H,: ß < 0
O Ho: B# 0; H,: ß = 0
O Hoi ß = 0; H,: ß > 0
Based on the P-value in the printout, do we reject or fail to reject the null hypothesis for a = 0.01?
O Reject the null hypothesis. There is sufficient evidence that ß differs from 0.
O
Fail to reject the null hypothesis. There is insufficient evidence that ß differs from 0.
O Fail to reject the null hypothesis. There is sufficient evidence that ß differs from 0.
O Reject the null hypothesis. There is insufficient evidence that ß differs from 0.
(d) Recall that the t value and resulting P-value of the slope b equal the t value and resulting P-value of the corresponding
correlation coefficient r. To find the value of the sample correlation coefficient r, take the square root of the "R-Sq" value
shown in the display. What is the value of r? (Round your answer to three decimal places.)
Consider a two-tailed test for r. Based on the P-value shown in the Minitab display, is the correlation coefficient significant
at the 1% level of significance?
O No, the correlation coefficient is not significant at the a = 0.01 level because the P-value s a.
O Yes, the correlation coefficient is significant at the a = 0.01 level because the P-value > a.
O Yes, the correlation coefficient is significant at the a = 0.01 level because the P-value s a.
O No, the correlation coefficient is not significant at the a = 0.01 level because the P-value > a.
Expert Solution
This question has been solved!
Explore an expertly crafted, step-by-step solution for a thorough understanding of key concepts.

This is a popular solution!

Trending now
This is a popular solution!

Step by step
Solved in 2 steps with 2 images

Recommended textbooks for you
Algebra & Trigonometry with Analytic Geometry
Algebra
ISBN:
9781133382119
Author:
Swokowski
Publisher:
Cengage

Glencoe Algebra 1, Student Edition, 9780079039897…
Algebra
ISBN:
9780079039897
Author:
Carter
Publisher:
McGraw Hill
Algebra & Trigonometry with Analytic Geometry
Algebra
ISBN:
9781133382119
Author:
Swokowski
Publisher:
Cengage
Glencoe Algebra 1, Student Edition, 9780079039897…
Algebra
ISBN:
9780079039897
Author:
Carter
Publisher:
McGraw Hill