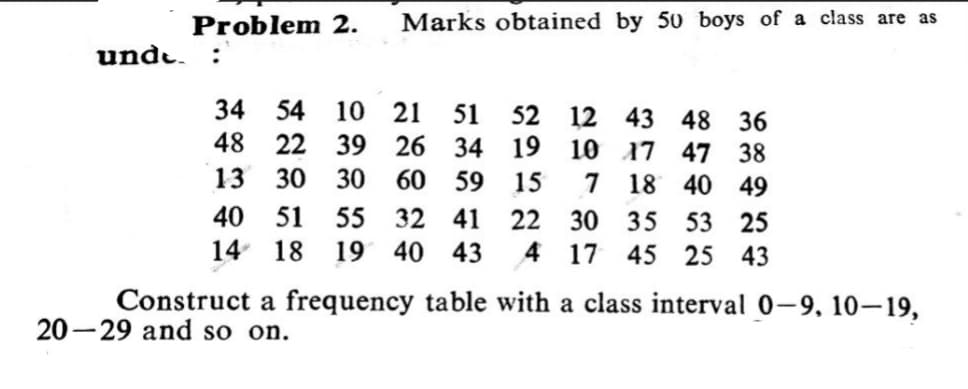
Problem 2. Marks obtained by 50 boys of a class are as unde. : 34 54 10 21 22 39 26 34 19 51 52 12 43 48 36 48 10 17 47 38 13 30 30 60 59 15 7 18 40 49 40 51 55 32 41 22 14 18 19 40 43 30 35 4 53 25 17 45 25 43 Construct a frequency table with a class interval 0-9. 10–19, 20-29 and so on.


Q: The reaction time of a driver to visual stimulus is normally distributed with a mean of 0.4 seconds ...
A:
Q: An upward sloping linear trend line through a scatter plot indicates a a) postive mean b) nega...
A: An upward sloping linear trend line through a scatter plot indicates a
Q: Age (years) Each person in the survey summarized in the table was asked their response to the statem...
A:
Q: The following frequency distribution summarizes the counts of purchases by day of the week for a maj...
A: The given problem is based on finding the relative frequency distribution and construction of a bar ...
Q: What are the limitations of the mean
A: A.M is a ratio of sum of observations to the number of observations.
Q: standard 9 Exercise B You are driving home one night and must decide if you have enough gas to get h...
A: Disclaimer: Since you have posted a question with multiple sub-parts, we will solve the first three ...
Q: If 12 = 0-5, r31 = 0-3, r23 0-45, find R3.12. %3D
A: When more than two variables are to establish the degree of relationship then the correlation is sai...
Q: For a population with mean of 50 and standard deviation of 8, what is the raw score that corresponds...
A: Given,mean(μ)=50standard deviation(σ)=8
Q: A regression is an analysis of the independent factors that influence a dependent variable: a) True...
A: We have given that the statement “ A regression is an analysis of the independent factors that influ...
Q: A stamping machine produces can tops whose diameters are normally distributed with a mean of 2.950 i...
A: We have given that A stamping machine produces can tops whose diameters are normally distributed wi...
Q: 3. [Management Decision] Management must make a decision concerning the adoption of either plan I or...
A: Let 1 and 2 be the subscript for the plan I and plan II, respectively. Then, provided that the sampl...
Q: The average number of days absent per student per year at West Valley School is 17 days with a stand...
A: mean = μ = 17standard deviation = σ = 4
Q: Two variables have a correlation coefficient of -0.09. The coefficient of determination could be a) ...
A: Given : Correlation coefficient (r) = -0.09
Q: A high school class has 150 students. 120 of them passed the MATH test; 20 students of the whole cla...
A: Given The data is as follows: Total no. of students in high school =150 120 passed in Math test. 20...
Q: Assume X is normally distributed with a mean of 10 and a standard deviation of 2. Determine the foll...
A:
Q: pla gav 0.251 0.263 0.239 1.0 0.299 5.0 0.286 0.268 0.339 3.3 5.5 3.8 3.5 7.3 USE SALT catter diagra...
A: Given: x y 0.239 1 0.251 3.3 0.286 5.5 0.263 3.8 0.268 3.5 0.339 7.3 0.299 5
Q: You are conducting contract research for a client that involves a questionnaire survey. The client p...
A:
Q: X is a binomial random variable with n=20 and p=.4. Find P(X=6) Question 1 options: .240 ....
A:
Q: each event listed, indicate which definition(s) of probability would be appropriate (circle them), a...
A: Given: The height of great great grand father is more than 6 feet. The appropriate choice of probab...
Q: Direction: Calculate the t-statistic for each of the following. Write your answer on the space provi...
A: It is given that Sample size n = 12 Sample mean = 15 Population mean = 12 Sample SD = 4
Q: 6. 300- Real estate is typically reassessed annually for property tax purposes. This assessed value,...
A: Introduction: Denote β1 as the true slope of the regression line while predicting the actual sales p...
Q: The mean score of a competency test is 69, with a standard 1) deviation of 6. Use the Empirical Rule...
A:
Q: A distribution of exam scores has a population mean of 90 and a population standard deviation of 10....
A:
Q: Use the data in the following table, which lists drive-thru order accuracy at popular fast food chai...
A: Solution: The given table is A B C D Total Order Accurate 326 273 233 149 981 Order Not A...
Q: What is the probability that out of 60 lambs born on BaaBaa Farm, at least 31 will be male? Assume t...
A:
Q: Deal 10 cards from a standard deck (52 cards). What is the probability that the 6th card is a queen,...
A: Given that, It is a standard deck. So, the number of queens available in a stand...
Q: A random sample of male nontraditional students at a Midwestern University yields the following ages...
A:
Q: The juror pool for an upcoming trial contains 100,000 individuals in the population who may be calle...
A: Given : The juror pool for an upcoming trial contains 100000 no. of individuals in the population wh...
Q: čach of 20 lots of rubber belts contains 2000 rubber belts. Number of defective rubber belts in thos...
A:
Q: For a population with mean of 50 and standard deviation of 8, what is the Z-score that corresponds t...
A:
Q: Suppose data from 2010 states that 11.7% of Americans are without health insurance. We take a random...
A: Solution: Given information: p= 0.117 Population proportion of Americans without health insurance. ...
Q: A researcher wishes to estimate the average blood alcohol concentration (BAC) for drivers involved i...
A:
Q: A box contains 5 balls. Two are numbered 3, one is numbered 4, and two are numbered 5. The balls are...
A:
Q: If the mean of a distribution is greater than its median, then a) the distribution has a very high ...
A: If the mean of the distribution is greater than median, then the distribution is skewed. It can be r...
Q: America’s image abroad ~ Around the world, favorable views of the U.S. rebounded in 2021, according ...
A:
Q: Previous Problem Problem List Next Problem An algebra class has 8 students and 8 desks. For the sake...
A: Given that
Q: (13) Let a, b, c, d be constants. If all of the following covariances are well defined then show tha...
A: Solution
Q: lake contains 100 fish, 20 of which have been tagged as part of a study. Four fish are chosen at ran...
A: Given that Total fish=100 Tagged fish=20 4 fish are chosen at random Note: According to bartleby e...
Q: 6. The following table gives the frequency distribution of marks obtained by 150 students in a certa...
A:
Q: In a standard Normal model, state what value(s) of z cuts off the described region. Choose the best ...
A: Let Z be the random variable from standard normal distribution with mean = 0 and standard deviation ...
Q: CH10: An independent-measures study was completed by Dr. Savannah Dean who tested n1 = difference to...
A: Given; x1-x2=20 n1=6 n2=21 sp2=93
Q: Here is some data for two variables: "Number of Office Hours Visits" and "Score in the Class." The c...
A: The proportion of variability in the variable "score" that can be explained (or attributable) by th...
Q: Determine the value of c. B. Solve for E[W^3]
A:
Q: What is the mean of a distribution with a population standard deviation of 8, and a raw score of X=4...
A:
Q: gan legends every day for the past few months. As you play recorded the number of wins you have per ...
A:
Q: ) What is the probability that there are exactly 2 defective phone batteries in the sample? ) What i...
A: NOTE-AS PER COMPANY POLICY I HAVE CALCULATED FIRST 3 SUBPARTS PLZ RESUBMITS OTHER PARTS AGAIN Here...
Q: t-observed to be . .
A: An independent-measures study was completed by Dr. Savannah Deanne who tested n₁ = 6 and = 21 partic...
Q: Please simply write the letter for the test as your answer. Here are the tests: A: one sample z-tes ...
A: The test is to check whether the dinosaur skulls belong to the rare Zotosaurus family or not.
Q: 3. If X has a uniform distribution in (0,1) with p.d.f f(x)=1, 0<x<1 = 0, otherwise. Find the distri...
A:
Q: Calculate the t-statistic for each of the following
A: The objective is to calculate t statistic

Step by step
Solved in 2 steps with 1 images

- Figure 219 shows a compound gear train. Gears B and C are keyed to the same shaft; therefore, they turn at the same speed. Gear A and gear C are driving gears. Gear B and gear D are driven gears. Set up a proportion for each problem and determine the unknown values, x, y, and z in the table. Round the answers to 1 decimal place where necessary.A set of scores ranges from a high of X = 45 to a low of X = 11. If these scores were placed in an appropriately designed grouped frequency distribution table, which of the following would be the bottom interval in the table?1. Create the frequency table of the data.
- The following are goals scored by a soccer team at each game in their recent season. Complete the frequency table. 0 0 0 0 0 1 1 1 1 1 1 1 1 1 1 1 2 2 2 2 3 3 3 3 4 4 5 A) Goals Frequency 0 7 1 11 2 3 3 4 4 1 5 0 6 2 B) Goals Frequency 0 7 1 11 2 3 3 0 4 3 5 2 6 2 C) Goals Frequency 0 5 1 12 2 4 3 4 4 2 5 2 6 0 D) Goals Frequency 0 7 1 12 2 4 3 2 4 0 5 4 6 0 E) Goals Frequency 0 5 1 12 2 4 3 0 4 3 5 2 6 2 F) Goals Frequency 0 5 1 11 2 4 3 4 4 2 5 1 6 0Problem – 2:The data shown (in millions of dollars) are the values of the 30 National Football Leaguefranchises.170 191 171 235 173 187 181 191200 218 243 200 182 320 184 239186 199 186 210 209 240 204 193211 186 197 204 188 242a) Construct a frequency distribution for the data using 8 classes.b) Construct a histogram, a frequency polygon, and an ogive for the data.Question 13 Consider an operational process in a factory where widgets are produced. As the process is not perfect, errors sometimes happen, and the errors are either technical or human. Over the last 100 days, errors were observed and recorded. On any given day, there occurred zero to three (0 to 3) human errors and zero to three (0 to 3) technical errors. The frequency distribution of errors is given in the following contingency table. Number of human errors No. of Tech Errors 0 1 2 3 Total 0 8 6 4 4 22 1 5 8 9 10 32 2 4 5 10 8 27 3 0 3 4 12 19 Total 17 22 27 34 100 What is the probability of 3 technical errors on any given day? State your answer as a decimal value rounded to two digits after the decimal point.
- Question 15 Consider an operational process in a factory where widgets are produced. As the process is not perfect, errors sometimes happen, and the errors are either technical or human. Over the last 100 days, errors were observed and recorded. On any given day, there occurred zero to three (0 to 3) human errors and zero to three (0 to 3) technical errors. The frequency distribution of errors is given in the following contingency table. Number of human errors No. of Tech Errors 0 1 2 3 Total 0 8 6 4 4 22 1 5 8 9 10 32 2 4 5 10 8 27 3 0 3 4 12 19 Total 17 22 27 34 100 What is the probability of 3 human errors on any given day? State your answer as a decimal value rounded to two digits after the decimal point.The data below are the passing scores on an Algebra exam in one class. For this question, round all answers to the nearest tenth, as needed. 60 68 88 76 60 92 92 92 88 60 68 92 8892 64 60 76 64 92 88 76 60 60 64 60 8876 64 Construct the frequency table by using five classes. Class Limit Frequency Class midpoint Cumulative Frequency Class BoundaryIn the manufacturing of a certain scientific instrument great importance is attached to the life of a particular critical component. This component is obtained in bulk from two sources, A and B, and in the course of inspection, the lives of 1000 of the components from each source are determined. The following frequency tables are obtained:- Source A Source A Source B Source B Life (hours) No of components Life(hours) No of Components 1000-1020 1020-1040 1040-1060 1060-1080 1080-1100 1100-1120 40 96 364 372 85 43 1030-1040 1040-1050 1050-1060 1060-1070 1070-1080 1080-1090 339 136 25 20 130 350 i. Find Median and two quartiles for each group. ii. Find mean and Standard deviation for each source and compare them. iii. Which source do you think providing better quality of components and why?
- In the manufacturing of a certain scientific instrument great importance is attached to the life of a particular critical component. This component is obtained in bulk from two sources, A and B, and in the course of inspection, the lives of 1000 of the components from each source are determined. The following frequency tables are obtained: - [3] Source A Source B Life (hours) No of components Life(hours) No of Components 1000-1020 1020-1040 1040-1060 1060-1080 1080-1100 1100-1120 40 x 364 372 85 43 1030-1040 1040-1050 1050-1060 1060-1070 1070-1080 1080-1090 339 136 25 20 130 350 Find missing value of x and Standard deviation, when = 1059.90 for each source and compare them.In the manufacture of a certain scientific instrument great importance is attached to the life of a critical component. This component is obtained in bulk from two sources, A and B, and in a course of inspection, the lives of 1000 of the components from each source are determined. The following frequency tables are obtained:Source A Source BLife (hours) No. of components Life (hours) No. of components1000 – 1020 40 1030 – 1040 3391020 – 1040 96 1040 – 1050 1361040 – 1060 364 1050 – 1060 251060 – 1080 372 1060 – 1070 201080 – 1100 85 1070 – 1080 1301100 – 1120 43 1080 – 1090 350Examine the effectiveness of the measures of dispersion with which you are familiar for comparing the dispersion of the two distributionsquestion 18 In California, we need more rain to sustain the health of our natural environment, argriculture, and economic. A group of statistics students in Oxnard College recorded the amount of rain during 2016-2017 school year, measuring the intensity by the inches of rain, and the results were: Inches of Rain 1 2 3 4 5 6 Frequency 0 6 2 5 5 7 The mean (¯xx¯) rain intensity: inches (Please show your answer to 1 decimal place.)The median rain intensity: inchesThe mode rain intensity: inches (Please separate your answers by ',' in the bimodal situation. Enter DNE if there is no mode or if there are more than two modes.)
