Choose the correct graph of the forecast demands below. ○ A. 70- 65- 60- 55- 50- 45- ○ C. Jan. Feb. Mar. Apr. May June July Aug. Sep. Oct. Nov. Dec. 65- 50- 45- 40+ Jan. Feb. Mar. Apr. May June July Aug. Sep. Oct. Nov. Dec. 70- 65 B. 60- 55 50 45- 404 D. Q 65- 60- 55- 50- 45- Jan. Feb. Mar. Apr. May June July Aug. Sep. Oct. Nov. Dec. Jan. Feb. Mar. Apr. May June July Aug. Sep. Oct. Nov. Dec. Q Prepare a graph of the monthly forecasts and average forecast demand for Chicago Paint Corp., a manufacturer of specialized paint for artists. Compute the demand per day for each month (round your responses to one decimal place). Month Production Days Demand Forecast Demand per Day January 21 950 February 19 1,150 March 21 1,250 April 22 1,250 May 21 1,200 June 22 1,300 July 22 1,250 August 21 1,150 September 22 1,150 October 22 1,000 November 21 1,000 December 21 850
Choose the correct graph of the forecast demands below. ○ A. 70- 65- 60- 55- 50- 45- ○ C. Jan. Feb. Mar. Apr. May June July Aug. Sep. Oct. Nov. Dec. 65- 50- 45- 40+ Jan. Feb. Mar. Apr. May June July Aug. Sep. Oct. Nov. Dec. 70- 65 B. 60- 55 50 45- 404 D. Q 65- 60- 55- 50- 45- Jan. Feb. Mar. Apr. May June July Aug. Sep. Oct. Nov. Dec. Jan. Feb. Mar. Apr. May June July Aug. Sep. Oct. Nov. Dec. Q Prepare a graph of the monthly forecasts and average forecast demand for Chicago Paint Corp., a manufacturer of specialized paint for artists. Compute the demand per day for each month (round your responses to one decimal place). Month Production Days Demand Forecast Demand per Day January 21 950 February 19 1,150 March 21 1,250 April 22 1,250 May 21 1,200 June 22 1,300 July 22 1,250 August 21 1,150 September 22 1,150 October 22 1,000 November 21 1,000 December 21 850

Practical Management Science
6th Edition
ISBN:9781337406659
Author:WINSTON, Wayne L.
Publisher:WINSTON, Wayne L.
Chapter9: Decision Making Under Uncertainty
Section: Chapter Questions
Problem 46P

Related questions
Question
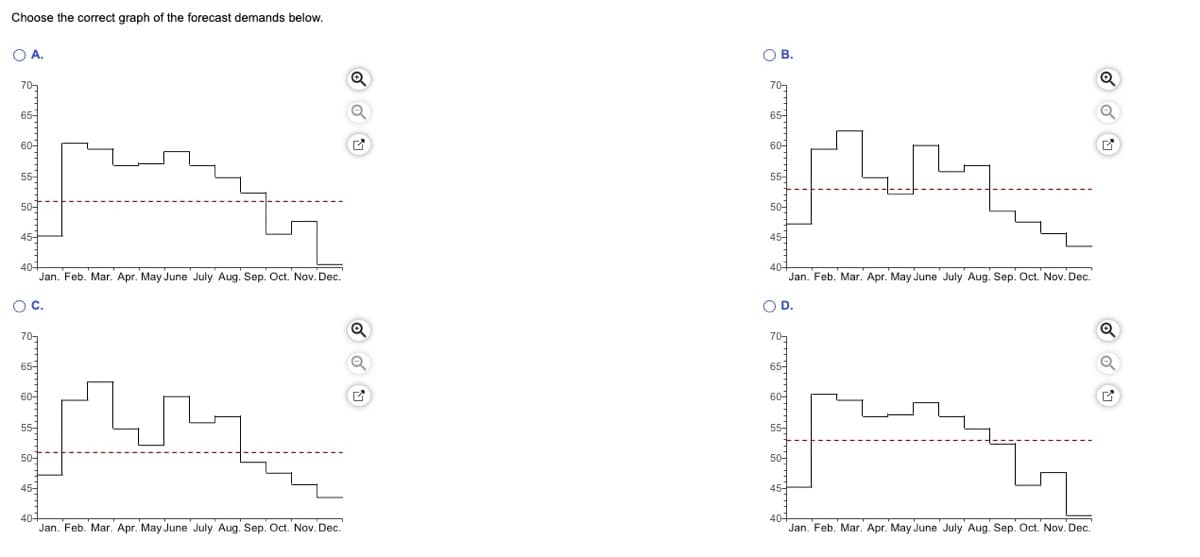
Transcribed Image Text:Choose the correct graph of the forecast demands below.
○ A.
70-
65-
60-
55-
50-
45-
○ C.
Jan. Feb. Mar. Apr. May June July Aug. Sep. Oct. Nov. Dec.
65-
50-
45-
40+
Jan. Feb. Mar. Apr. May June July Aug. Sep. Oct. Nov. Dec.
70-
65
B.
60-
55
50
45-
404
D.
Q
65-
60-
55-
50-
45-
Jan. Feb. Mar. Apr. May June July Aug. Sep. Oct. Nov. Dec.
Jan. Feb. Mar. Apr. May June July Aug. Sep. Oct. Nov. Dec.
Q
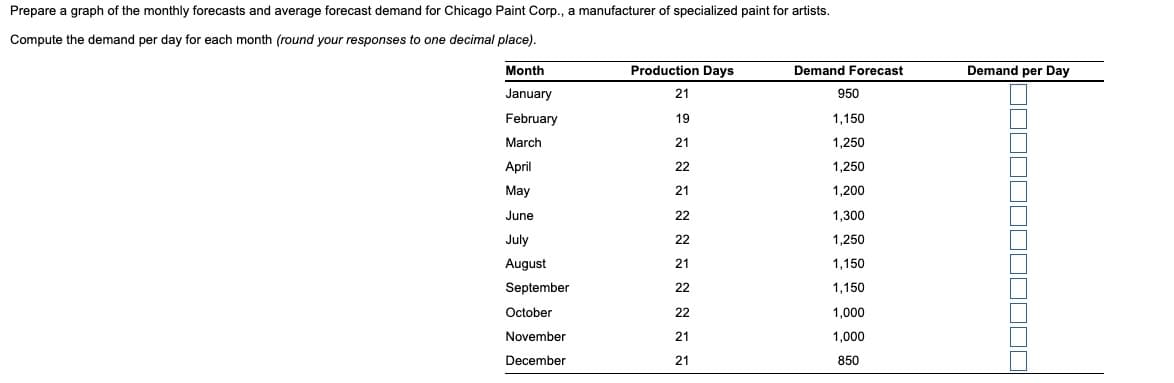
Transcribed Image Text:Prepare a graph of the monthly forecasts and average forecast demand for Chicago Paint Corp., a manufacturer of specialized paint for artists.
Compute the demand per day for each month (round your responses to one decimal place).
Month
Production Days
Demand Forecast
Demand per Day
January
21
950
February
19
1,150
March
21
1,250
April
22
1,250
May
21
1,200
June
22
1,300
July
22
1,250
August
21
1,150
September
22
1,150
October
22
1,000
November
21
1,000
December
21
850
Expert Solution
This question has been solved!
Explore an expertly crafted, step-by-step solution for a thorough understanding of key concepts.

This is a popular solution!

Trending now
This is a popular solution!

Step by step
Solved in 2 steps

Recommended textbooks for you
Practical Management Science
Operations Management
ISBN:
9781337406659
Author:
WINSTON, Wayne L.
Publisher:
Cengage,

Contemporary Marketing
Marketing
ISBN:
9780357033777
Author:
Louis E. Boone, David L. Kurtz
Publisher:
Cengage Learning

Marketing
Marketing
ISBN:
9780357033791
Author:
Pride, William M
Publisher:
South Western Educational Publishing
Practical Management Science
Operations Management
ISBN:
9781337406659
Author:
WINSTON, Wayne L.
Publisher:
Cengage,
Contemporary Marketing
Marketing
ISBN:
9780357033777
Author:
Louis E. Boone, David L. Kurtz
Publisher:
Cengage Learning
Marketing
Marketing
ISBN:
9780357033791
Author:
Pride, William M
Publisher:
South Western Educational Publishing

Purchasing and Supply Chain Management
Operations Management
ISBN:
9781285869681
Author:
Robert M. Monczka, Robert B. Handfield, Larry C. Giunipero, James L. Patterson
Publisher:
Cengage Learning