Intermediate Accounting: Reporting And Analysis
3rd Edition
ISBN:9781337788281
Author:James M. Wahlen, Jefferson P. Jones, Donald Pagach
Publisher:James M. Wahlen, Jefferson P. Jones, Donald Pagach
Chapter5: The Income Statement And The Statement Of Cash Flows
Section: Chapter Questions
Problem 20P
Related questions
Question
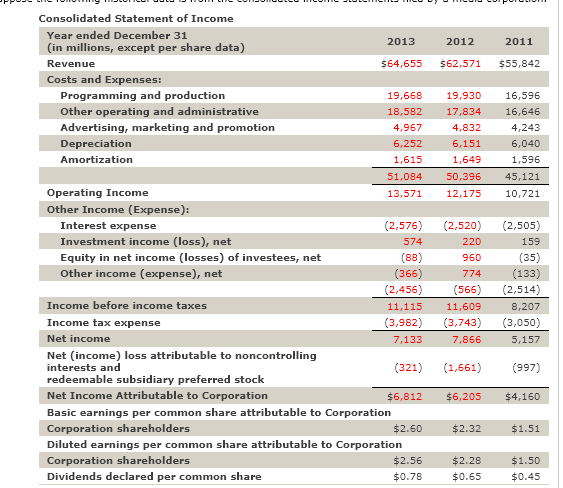
Suppose the following historical data is from the consolidated income statements filed by a media corporation.
*chart attached*
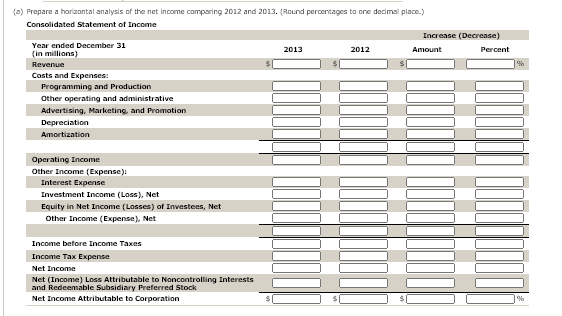
A): Prepare a horizontal analysis of the net income comparing 2012 and 2013. (Round percentages to one decimal place.)
(how to answer chart is attached)

Transcribed Image Text:Consolidated Statement of Income
Year ended December 31
2013
2012
2011
(in millions, except per share data)
Revenue
$64,655
$62,571
$55,842
Costs and Expenses:
Programming and production
Other operating and administrative
Advertising, marketing and promotion
19,668
19,930
16,596
18,582
17,834
16,646
4,967
4,832
4,243
Depreciation
6,252
6,151
6,040
Amortization
1,615
1,649
1,596
51,084
50,396
45,121
Operating Income
13,571
12,175
10,721
Other Income (Expense):
Interest expense
(2,576)
(2,520)
(2,505)
Investment income (loss), net
574
220
159
Equity in net income (losses) of investees, net
(88)
(366)
(35)
(133)
(2,514)
960
Other income (expense), net
774
(2,456)
(566)
Income before income taxes
11,115
11,609
8,207
Income tax expense
(3,982)
(3,743)
(3,050)
Net income
7,133
7,866
5,157
Net (income) loss attributable to noncontrolling
interests and
redeemable subsidiary preferred stock
(321)
(1,661)
(997)
Net Income Attributable to Corporation
$6,812
$6,205
$4,160
Basic earnings per common share attributable to Corporation
Corporation shareholders
$2.60
$2.32
$1.51
Diluted earnings per common share attributable to Corporation
Corporation shareholders
$2.56
$2.28
$1.50
Dividends declared per common share
$0.78
$0.65
$0.45

Transcribed Image Text:(a) Prepare a horizantal analysis of the net income comparing 2012 and 2013. (Round percentages to one decimal place.)
Consolidated Statement of Income
Increase (Decrease)
Year ended December 31
2013
2012
Amount
Percent
(in millions)
Revenue
Costs and Expenses:
Programming and Production
Other operating and administrative
Advertising, Marketing, and Promotion
Depreciation
Amortization
Operating Income
Other Income (Expense):
Interest Expense
Investment Income (Loss), Net
Equity in Net Income (Losses) of Investees, Net
Other Income (Expense), Net
Income before Income Taxes
Income Tax Expense
Net Income
Net (Income) Loss Attributable to Noncontrolling Interests
and Redeemable Subsidiary Preferred Stock
Net Income Attributable to Corporation
Expert Solution
This question has been solved!
Explore an expertly crafted, step-by-step solution for a thorough understanding of key concepts.
This is a popular solution!
Trending now
This is a popular solution!
Step by step
Solved in 2 steps with 2 images

Knowledge Booster
Learn more about
Need a deep-dive on the concept behind this application? Look no further. Learn more about this topic, finance and related others by exploring similar questions and additional content below.Recommended textbooks for you

Intermediate Accounting: Reporting And Analysis
Accounting
ISBN:
9781337788281
Author:
James M. Wahlen, Jefferson P. Jones, Donald Pagach
Publisher:
Cengage Learning

Intermediate Accounting: Reporting And Analysis
Accounting
ISBN:
9781337788281
Author:
James M. Wahlen, Jefferson P. Jones, Donald Pagach
Publisher:
Cengage Learning