Given are the statements of financial position, income statements, and other pertinent data for ABC Corporation (see previous page). The amounts are historical data for 2018 and 2019 and expected (E) amounts for 2020. Requirements: 1. Compute the given ratios for 2020E. Fill in the yellow blanks on the picture.
Given are the statements of financial position, income statements, and other pertinent data for ABC Corporation (see previous page). The amounts are historical data for 2018 and 2019 and expected (E) amounts for 2020. Requirements: 1. Compute the given ratios for 2020E. Fill in the yellow blanks on the picture.

Chapter1: Financial Statements And Business Decisions
Section: Chapter Questions
Problem 1Q

Related questions
Question
100%
| Given are the The amounts are historical data for 2018 and 2019 and expected (E) amounts for 2020. |
||||
| Requirements: | ||||
| 1. Compute the given ratios for 2020E. Fill in the yellow blanks on the picture. | ||||
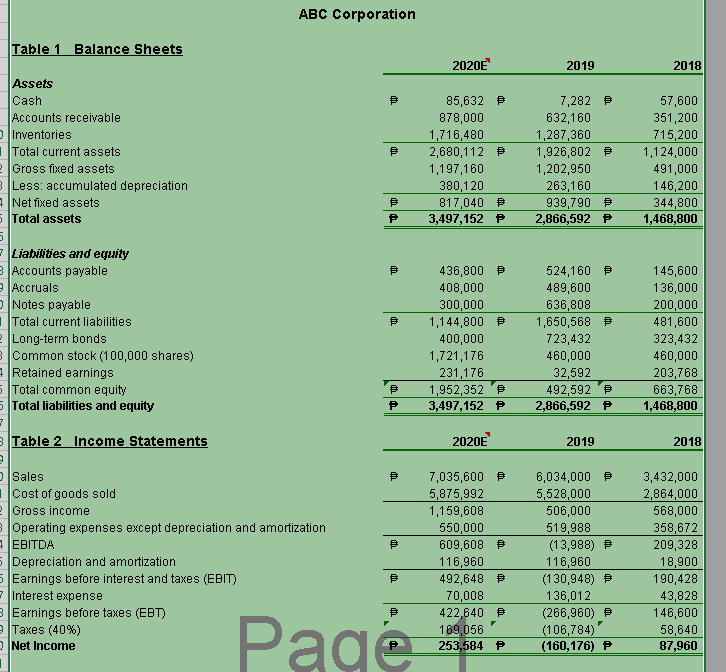
Transcribed Image Text:ABC Corporation
Table 1 Balance Sheets
2020E
2019
2018
Assets
85,632 P
878,000
Cash
7,282 P
57,600
Accounts receivable
632,160
351,200
DInventories
|Total current assets
2Gross fixed assets
B Less: accumulated depreciation
4Net fixed assets
5 Total assets
1,716,480
1,287,360
1,926,802 P
1,202,950
263,160
939,790 P
2,866,592 P
715,200
2,680,112 P
1,124,000
1,197,160
491,000
380,120
817,040 P
3,497,152 P
146,200
344,800
1,468,800
P
- Liabilities and equity
B Accounts payable
e Accruals
DNotes payable
|Total current liabilities
e Long-term bonds
3 Common stock (100,000 shares)
a Retained earnings
5 Total common equity
5 Total liabilities and equity
436,800 P
524,160 P
145,600
408,000
489,600
136,000
300,000
1,144,800 P
400,000
636,808
200,000
481,600
1,650,568 P
723,432
323,432
1,721,176
460,000
460,000
231,176
32,592
203,768
1,952,352 P
492,592
2,866,592 P
663,768
1,468,800
3,497,152 P
3 Table 2 Income Statements
2020E
2019
2018
DSales
7,035,600 P
5,875,992
1,159,608
6,034,000 P
5,528,000
506,000
3,432,000
2,864,000
568,000
Cost of goods sold
e Gross income
3 Operating expenses except depreciation and amortization
A EBITDA
5 Depreciation and amortization
5Earnings before interest and taxes (EBIT)
- Interest expense
3 Earnings before taxes (EBT)
e Taxes (40%)
358,672
209,328
550,000
519,988
(13,988) P
116,960
(130,948) P
136,012
(266,960) P
(106,784)
(160,176) P
609,608 P
116,960
18,900
190,428
492,648 P
70,008
422,640 P
43,828
146,600
Pagé
189,056
253,584 P
58,640
87,960
DNet Incone
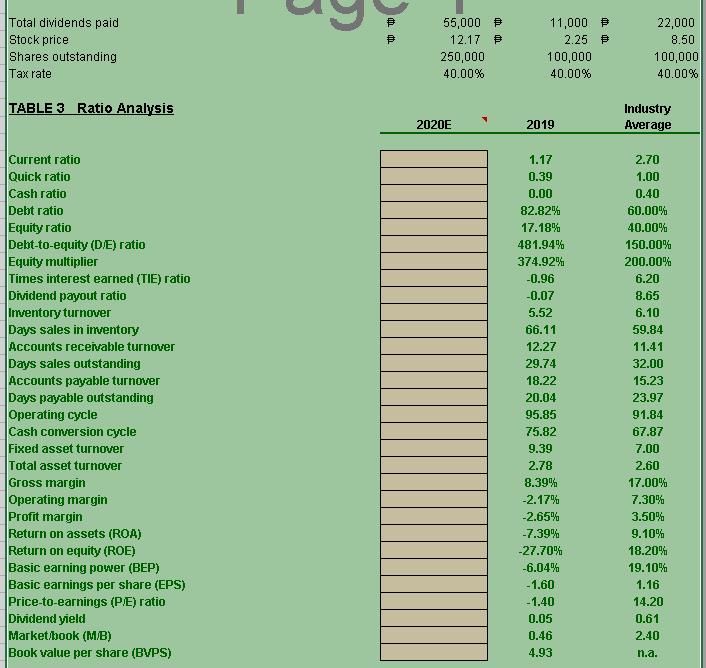
Transcribed Image Text:Total dividends paid
Stock price
Shares outstanding
55,000 P
11,000 P
22,000
12.17
2.25 P
8.50
250,000
100,000
100,000
|Таx rate
40.00%
40.00%
40.00%
TABLE 3 Ratio Analysis
Industry
2020E
2019
Average
Current ratio
Quick ratio
1.17
2.70
0.39
1.00
Cash ratio
0.00
0.40
Debt ratio
82.82%
60.00%
Equity ratio
17.18%
40.00%
Debt-to-equity (DE) ratio
481.94%
150.00%
Equity multiplier
Times interest earned (TIE) ratio
Dividend payout ratio
374.92%
200.00%
-0.96
6.20
-0.07
8.65
Inventory turnover
Days sales in imventory
5.52
6.10
66.11
59.84
Accounts receivable turnover
12.27
11.41
Days sales outstanding
29.74
32.00
Accounts payable turnover
18.22
15.23
Days payable outstanding
20.04
23.97
Operating cycle
Cash conversion cycle
95.85
91.84
75.82
67.87
Fixed asset turnover
9.39
7.00
Total asset turnover
2.78
2.60
Gross margin
8.39%
17.00%
Operating margin
Profit margin
Return on assets (ROA)
Return on equity (ROE)
Basic earning power (BEP)
Basic earnings per share (EPS)
Price-to-earnings (PE) ratio
Dividend yield
Market/book (MB)
Book value per share (BVPS)
-2.17%
7.30%
-2.65%
3.50%
-7.39%
9.10%
-27.70%
18.20%
-6.04%
19.10%
-1.60
1.16
-1.40
14.20
0.05
0.61
0.46
2.40
4.93
n.a.
Expert Solution
This question has been solved!
Explore an expertly crafted, step-by-step solution for a thorough understanding of key concepts.

This is a popular solution!

Trending now
This is a popular solution!

Step by step
Solved in 2 steps

Knowledge Booster


Learn more about
Need a deep-dive on the concept behind this application? Look no further. Learn more about this topic, accounting and related others by exploring similar questions and additional content below.Recommended textbooks for you

Accounting
Accounting
ISBN:
9781337272094
Author:
WARREN, Carl S., Reeve, James M., Duchac, Jonathan E.
Publisher:
Cengage Learning,

Accounting Information Systems
Accounting
ISBN:
9781337619202
Author:
Hall, James A.
Publisher:
Cengage Learning,
Accounting
Accounting
ISBN:
9781337272094
Author:
WARREN, Carl S., Reeve, James M., Duchac, Jonathan E.
Publisher:
Cengage Learning,
Accounting Information Systems
Accounting
ISBN:
9781337619202
Author:
Hall, James A.
Publisher:
Cengage Learning,

Horngren's Cost Accounting: A Managerial Emphasis…
Accounting
ISBN:
9780134475585
Author:
Srikant M. Datar, Madhav V. Rajan
Publisher:
PEARSON

Intermediate Accounting
Accounting
ISBN:
9781259722660
Author:
J. David Spiceland, Mark W. Nelson, Wayne M Thomas
Publisher:
McGraw-Hill Education

Financial and Managerial Accounting
Accounting
ISBN:
9781259726705
Author:
John J Wild, Ken W. Shaw, Barbara Chiappetta Fundamental Accounting Principles
Publisher:
McGraw-Hill Education