Price 0 D₁ Quantity Refer to the above diagram. A decrease in quantity demanded is depicted by a D₂ move from point x to point y. shift from D1 to D2. shift from D2 to D1. move from point y to point x.
Price 0 D₁ Quantity Refer to the above diagram. A decrease in quantity demanded is depicted by a D₂ move from point x to point y. shift from D1 to D2. shift from D2 to D1. move from point y to point x.

Chapter6: Elasticity
Section: Chapter Questions
Problem 2WNG: As the price of good X rises from 10 to 12, the quantity demanded of good Y rises from 100 units to...

Related questions
Question
c is not the answer
Transcribed Image Text:Price
0
D₁
Quantity
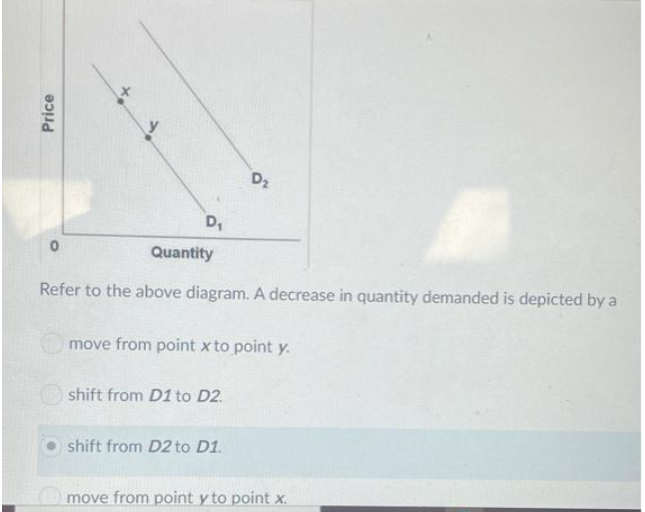
Refer to the above diagram. A decrease in quantity demanded is depicted by a
D₂
move from point x to point y.
shift from D1 to D2.
shift from D2 to D1.
move from point y to point x.
Expert Solution
This question has been solved!
Explore an expertly crafted, step-by-step solution for a thorough understanding of key concepts.

This is a popular solution!

Trending now
This is a popular solution!

Step by step
Solved in 3 steps

Knowledge Booster


Learn more about
Need a deep-dive on the concept behind this application? Look no further. Learn more about this topic, economics and related others by exploring similar questions and additional content below.Recommended textbooks for you

Economics (MindTap Course List)
Economics
ISBN:
9781337617383
Author:
Roger A. Arnold
Publisher:
Cengage Learning

Economics (MindTap Course List)
Economics
ISBN:
9781337617383
Author:
Roger A. Arnold
Publisher:
Cengage Learning


Brief Principles of Macroeconomics (MindTap Cours…
Economics
ISBN:
9781337091985
Author:
N. Gregory Mankiw
Publisher:
Cengage Learning
