Price D2 D1 Quantity Which of the following scenarios is most likely to cause the change in the market for avocados reflected in the graph above? O Global recession dramatically reduces incomes everywhere O Eating more avocados are found to reduce blood sugar O New time saving techniques are used to harvest avocados O Urban sprawl is reducing the area in which avocados are grown
Price D2 D1 Quantity Which of the following scenarios is most likely to cause the change in the market for avocados reflected in the graph above? O Global recession dramatically reduces incomes everywhere O Eating more avocados are found to reduce blood sugar O New time saving techniques are used to harvest avocados O Urban sprawl is reducing the area in which avocados are grown

Principles of Economics 2e
2nd Edition
ISBN:9781947172364
Author:Steven A. Greenlaw; David Shapiro
Publisher:Steven A. Greenlaw; David Shapiro
Chapter2: Choice In A World Of Scarcity
Section: Chapter Questions
Problem 22CTQ: What assumptions about the economy must he true for the invisible hand to work? To what extent are...

Related questions
Question
Transcribed Image Text:ourses/76705/quizzes/99976/take/questions/1710702
pe
Question 9
4 pt
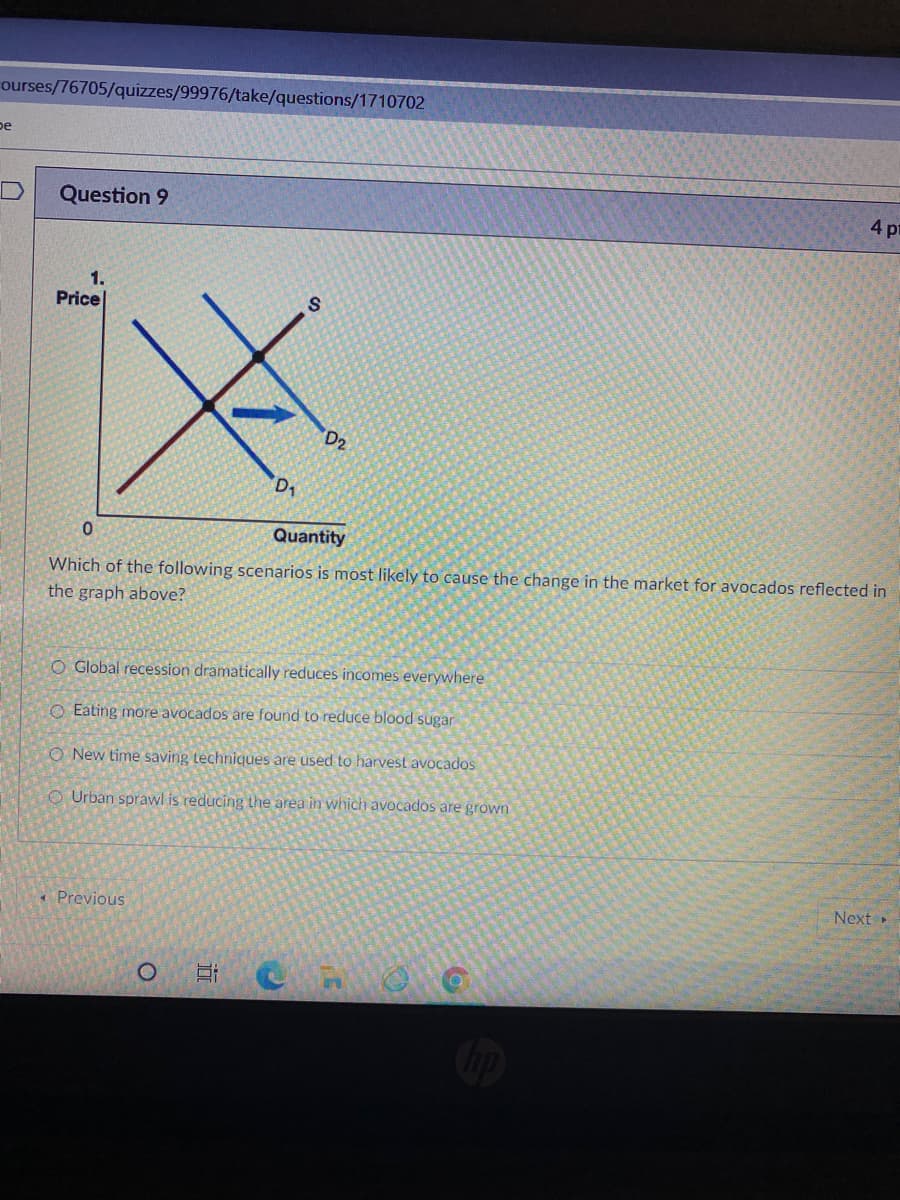
1.
Price
D2
D1
Quantity
Which of the following scenarios is most likely to cause the change in the market for avocados reflected in
the graph above?
O Global recession dramatically reduces incomes everywhere
O Eating more avocados are found to reduce blood sugar
O New time saving techniques are used to harvest avocados
O Urban sprawl is reducing the area in which avocados are grown
Next»
* Previous
Expert Solution
This question has been solved!
Explore an expertly crafted, step-by-step solution for a thorough understanding of key concepts.

This is a popular solution!

Trending now
This is a popular solution!

Step by step
Solved in 2 steps

Knowledge Booster


Learn more about
Need a deep-dive on the concept behind this application? Look no further. Learn more about this topic, economics and related others by exploring similar questions and additional content below.Recommended textbooks for you
Principles of Economics 2e
Economics
ISBN:
9781947172364
Author:
Steven A. Greenlaw; David Shapiro
Publisher:
OpenStax
Principles of Economics 2e
Economics
ISBN:
9781947172364
Author:
Steven A. Greenlaw; David Shapiro
Publisher:
OpenStax