Which of the graphs above would best represent the scenario where there has been an increase in the quantity demanded of apple juice? Graph A Graph B Graph C Graph D O None of the graphs above
Which of the graphs above would best represent the scenario where there has been an increase in the quantity demanded of apple juice? Graph A Graph B Graph C Graph D O None of the graphs above

Principles of Economics 2e
2nd Edition
ISBN:9781947172364
Author:Steven A. Greenlaw; David Shapiro
Publisher:Steven A. Greenlaw; David Shapiro
Chapter6: Consumer Choices
Section: Chapter Questions
Problem 11RQ: As a general rule, is it safe to assume that a change in the price of a good will always have its...

Related questions
Question
Please explain your answer
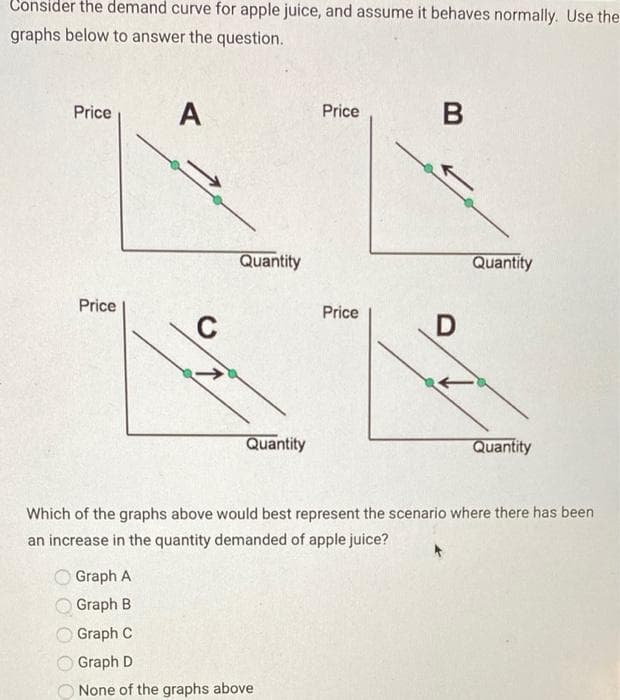
Transcribed Image Text:Consider the demand curve for apple juice, and assume it behaves normally. Use the
graphs below to answer the question.
Price
A
Price
Quantity
Quantity
Price
Price
C
Quantity
Quantity
Which of the graphs above would best represent the scenario where there has been
an increase in the quantity demanded of apple juice?
O Graph A
Graph B
Graph C
Graph D
None of the graphs above
Expert Solution
This question has been solved!
Explore an expertly crafted, step-by-step solution for a thorough understanding of key concepts.

This is a popular solution!

Trending now
This is a popular solution!

Step by step
Solved in 2 steps

Recommended textbooks for you
Principles of Economics 2e
Economics
ISBN:
9781947172364
Author:
Steven A. Greenlaw; David Shapiro
Publisher:
OpenStax

Brief Principles of Macroeconomics (MindTap Cours…
Economics
ISBN:
9781337091985
Author:
N. Gregory Mankiw
Publisher:
Cengage Learning

Principles of Economics 2e
Economics
ISBN:
9781947172364
Author:
Steven A. Greenlaw; David Shapiro
Publisher:
OpenStax
Brief Principles of Macroeconomics (MindTap Cours…
Economics
ISBN:
9781337091985
Author:
N. Gregory Mankiw
Publisher:
Cengage Learning

Exploring Economics
Economics
ISBN:
9781544336329
Author:
Robert L. Sexton
Publisher:
SAGE Publications, Inc

