PRICE (Dollars per bottle) 288 28 0 Supply Demand 0 18 36 54 72 90 108 126 144 102 100 QUANTITY (Thousands of bottles of wine) Entering 38.00 into the Price of Champagne field Entering 60.00 into the Price field Entering 3.00 into the Price of Grapes field Demand Curve Supply Curve Market for Wine Price (Dollars per bottle) B Quantity Demanded (Thousands of bottles) Surplus (Thousands of bottles) Demand Shifter Price of Champagne (Dollars per bottle) Green Line 0 48.00 a 36 Reset the graph to the initial state. Then, for each action described in the following table, indicate which elements on the graph (if any) are affected Check all that apply. (Note: After changing the value in each field, be sure to again refresh back to the initial value before proceeding to the next r in the table.) 108 50.00 O Quantity Demanded Quantity Supplied (Thousands of bottles) Shortage (Thousands of bottles) Supply Shifter Price of Grapes (Dollars per pound) Quantity Supplied 0 0 144 0 6.00 Surplus Shortag O 0 D
PRICE (Dollars per bottle) 288 28 0 Supply Demand 0 18 36 54 72 90 108 126 144 102 100 QUANTITY (Thousands of bottles of wine) Entering 38.00 into the Price of Champagne field Entering 60.00 into the Price field Entering 3.00 into the Price of Grapes field Demand Curve Supply Curve Market for Wine Price (Dollars per bottle) B Quantity Demanded (Thousands of bottles) Surplus (Thousands of bottles) Demand Shifter Price of Champagne (Dollars per bottle) Green Line 0 48.00 a 36 Reset the graph to the initial state. Then, for each action described in the following table, indicate which elements on the graph (if any) are affected Check all that apply. (Note: After changing the value in each field, be sure to again refresh back to the initial value before proceeding to the next r in the table.) 108 50.00 O Quantity Demanded Quantity Supplied (Thousands of bottles) Shortage (Thousands of bottles) Supply Shifter Price of Grapes (Dollars per pound) Quantity Supplied 0 0 144 0 6.00 Surplus Shortag O 0 D

Essentials of Economics (MindTap Course List)
8th Edition
ISBN:9781337091992
Author:N. Gregory Mankiw
Publisher:N. Gregory Mankiw
Chapter7: Consumers, Producers, And The Efficiency Of Markets
Section: Chapter Questions
Problem 8PA

Related questions
Question
G, 9
Economics
Transcribed Image Text:PRICE (Dollars per bottle)
80
8 399 887 200
54
48
12
6
Supply
0 18 30 54 72 90 105 126 144 102 100
QUANTITY (Thousands of bottles of wine)
Entering 38.00 into the Price of
Champagne field
Demand
Entering 60.00 into the Price field
Entering 3.00 into the Price of
Grapes field
Demand
Curve
O
A
Supply
Curve
Market for Wine
Ⓡ
Price
(Dollars per bottle)
Quantity
Demanded
(Thousands of
bottles)
Surplus
(Thousands of
bottles)
Demand Shifter
Price of
Champagne
(Dollars per bottle)
Green
Line
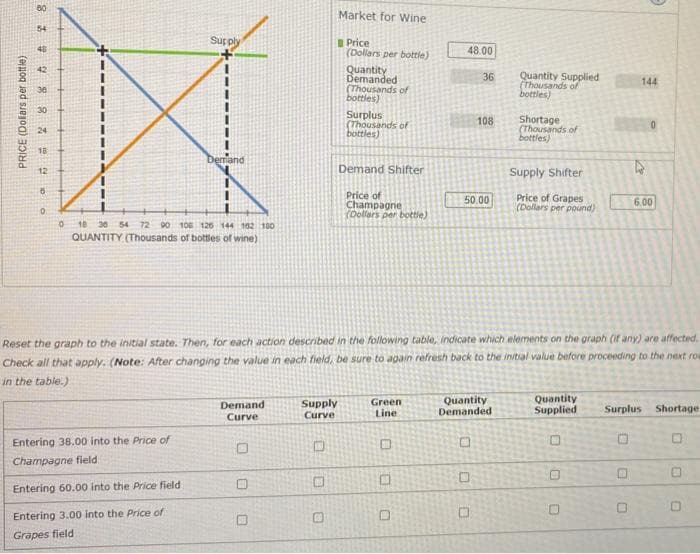
Reset the graph to the initial state. Then, for each action described in the following table, indicate which elements on the graph (if any) are affected.
Check all that apply. (Note: After changing the value in each field, be sure to again refresh back to the initial value before proceeding to the next row
in the table.)
0
0
48.00
0
50.00
36
0
108
Quantity
Demanded
0
U
Quantity Supplied
(Thousands of
bottles)
Shortage
(Thousands of
bottles)
Supply Shifter
Price of Grapes
(Dollars per pound)
Quantity
Supplied
0
0
144
O
6.00
Surplus Shortage
U
0
O
Expert Solution
This question has been solved!
Explore an expertly crafted, step-by-step solution for a thorough understanding of key concepts.

This is a popular solution!

Trending now
This is a popular solution!

Step by step
Solved in 5 steps

Recommended textbooks for you
Essentials of Economics (MindTap Course List)
Economics
ISBN:
9781337091992
Author:
N. Gregory Mankiw
Publisher:
Cengage Learning
Essentials of Economics (MindTap Course List)
Economics
ISBN:
9781337091992
Author:
N. Gregory Mankiw
Publisher:
Cengage Learning