Price (dollars per gallon) Supply, S, Тax $3.80 3.40 3.20 Demand 30 35 Quantity (billions of gallons per year) The figure above represents demand and supply in the market for gasoline. Using the diagram, after the government places the tax on the market, how much will the deadweight loss be?
Price (dollars per gallon) Supply, S, Тax $3.80 3.40 3.20 Demand 30 35 Quantity (billions of gallons per year) The figure above represents demand and supply in the market for gasoline. Using the diagram, after the government places the tax on the market, how much will the deadweight loss be?

Chapter5: Price Elasticity Of Demand And Supply
Section: Chapter Questions
Problem 16SQP

Related questions
Question
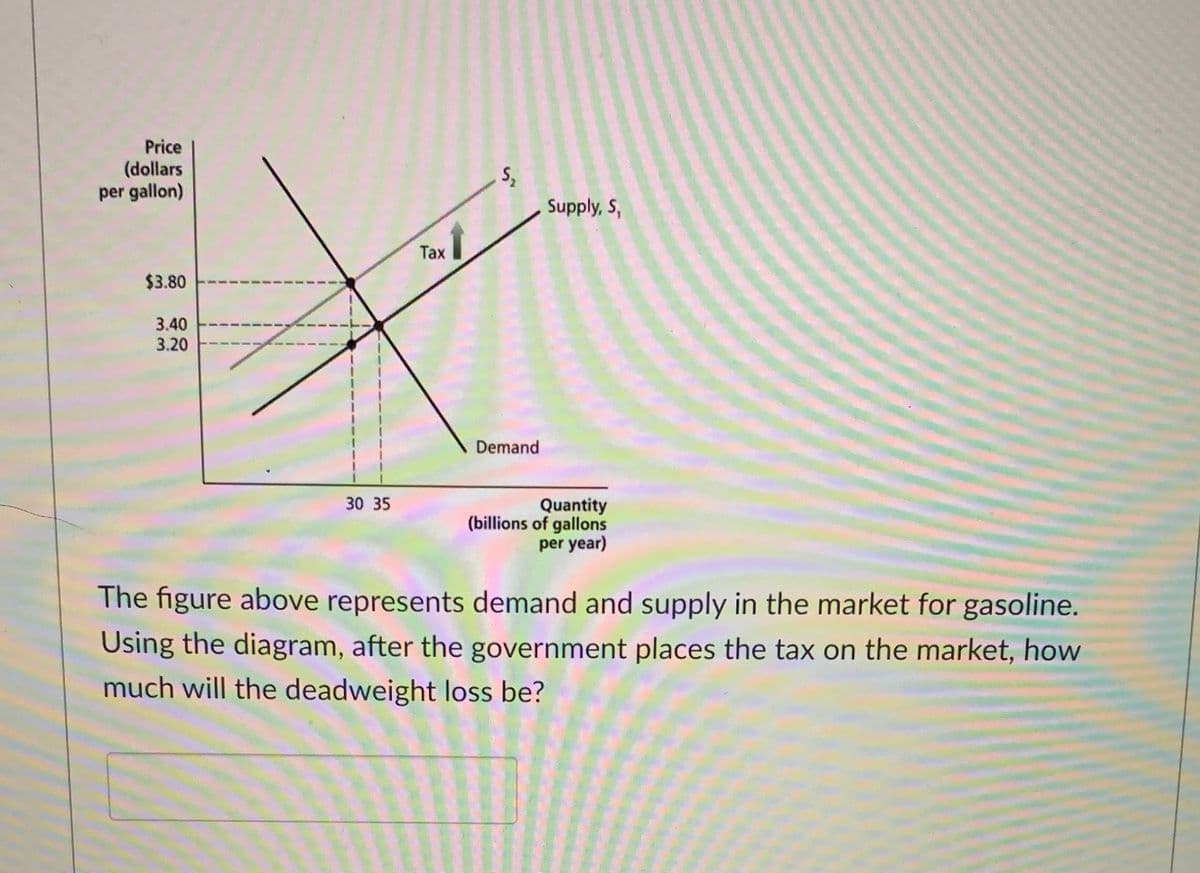
Transcribed Image Text:Price
(dollars
per gallon)
Supply, S,
Tax
$3.80
3.40
3.20
Demand
30 35
Quantity
(billions of gallons
per year)
The figure above represents demand and supply in the market for gasoline.
Using the diagram, after the government places the tax on the market, how
much will the deadweight loss be?

Transcribed Image Text:If a firm was interested in determining whether costs were increasing at an
increasing rate or increasing at a decreasing rate, they could examine the TC
curve visually. Instead of relying upon visual inspection, the firm could examine
the data generated by which formula below?
O AVC
O ATC
O AFC
AP (average product of labor)
O MC
Expert Solution
This question has been solved!
Explore an expertly crafted, step-by-step solution for a thorough understanding of key concepts.

This is a popular solution!

Trending now
This is a popular solution!

Step by step
Solved in 2 steps with 1 images

Knowledge Booster


Learn more about
Need a deep-dive on the concept behind this application? Look no further. Learn more about this topic, economics and related others by exploring similar questions and additional content below.Recommended textbooks for you


Essentials of Economics (MindTap Course List)
Economics
ISBN:
9781337091992
Author:
N. Gregory Mankiw
Publisher:
Cengage Learning

Principles of Microeconomics (MindTap Course List)
Economics
ISBN:
9781305971493
Author:
N. Gregory Mankiw
Publisher:
Cengage Learning

Principles of Macroeconomics (MindTap Course List)
Economics
ISBN:
9781285165912
Author:
N. Gregory Mankiw
Publisher:
Cengage Learning