PRICE (Dollars per pound) PRICE (Dollars per pound) Suppose that the perfectly competitive turkey industry is in long-run equilibrium at a price of $3 per pound of turkey and a quantity of 600 million pounds per year. Suppose the Surgeon General issues a report saying that eating turkey is bad for your health. The Surgeon General's report will cause consumers to demand turkey at every price. In the short run, firms will respond by Shift the supply curve, the demand curve, or both on the following diagram to illustrate these short-run effects of the Surgeon General's announcement. Note: Select and drag one or both of the curves to the desired position. Curves will snap into position, so if you try to move a curve and it snaps back to its original position, just drag it a little farther. Supply Demand Demand 0 0 200 400 600 800 1000 1200 QUANTITY (Millions of pounds) In the long run, some firms will respond by. Supply ? until Shift the supply curve, the demand curve, or both on the following diagram to illustrate both the short-run effects of the Surgeon General's announcement and the new long-run equilibrium after firms and consumers finish adjusting to the Surgeon General's announcement. 200 400 600 800 QUANTITY (Millions of pounds) Supply Demand Demand 1000 1200 Supply
PRICE (Dollars per pound) PRICE (Dollars per pound) Suppose that the perfectly competitive turkey industry is in long-run equilibrium at a price of $3 per pound of turkey and a quantity of 600 million pounds per year. Suppose the Surgeon General issues a report saying that eating turkey is bad for your health. The Surgeon General's report will cause consumers to demand turkey at every price. In the short run, firms will respond by Shift the supply curve, the demand curve, or both on the following diagram to illustrate these short-run effects of the Surgeon General's announcement. Note: Select and drag one or both of the curves to the desired position. Curves will snap into position, so if you try to move a curve and it snaps back to its original position, just drag it a little farther. Supply Demand Demand 0 0 200 400 600 800 1000 1200 QUANTITY (Millions of pounds) In the long run, some firms will respond by. Supply ? until Shift the supply curve, the demand curve, or both on the following diagram to illustrate both the short-run effects of the Surgeon General's announcement and the new long-run equilibrium after firms and consumers finish adjusting to the Surgeon General's announcement. 200 400 600 800 QUANTITY (Millions of pounds) Supply Demand Demand 1000 1200 Supply

Managerial Economics: A Problem Solving Approach
5th Edition
ISBN:9781337106665
Author:Luke M. Froeb, Brian T. McCann, Michael R. Ward, Mike Shor
Publisher:Luke M. Froeb, Brian T. McCann, Michael R. Ward, Mike Shor
Chapter5: Investment Decisions: Look Ahead And Reason Back
Section: Chapter Questions
Problem 5.5IP

Related questions
Question
Transcribed Image Text:PRICE (Dollars per pound)
1
PRICE (Dollars per pound)
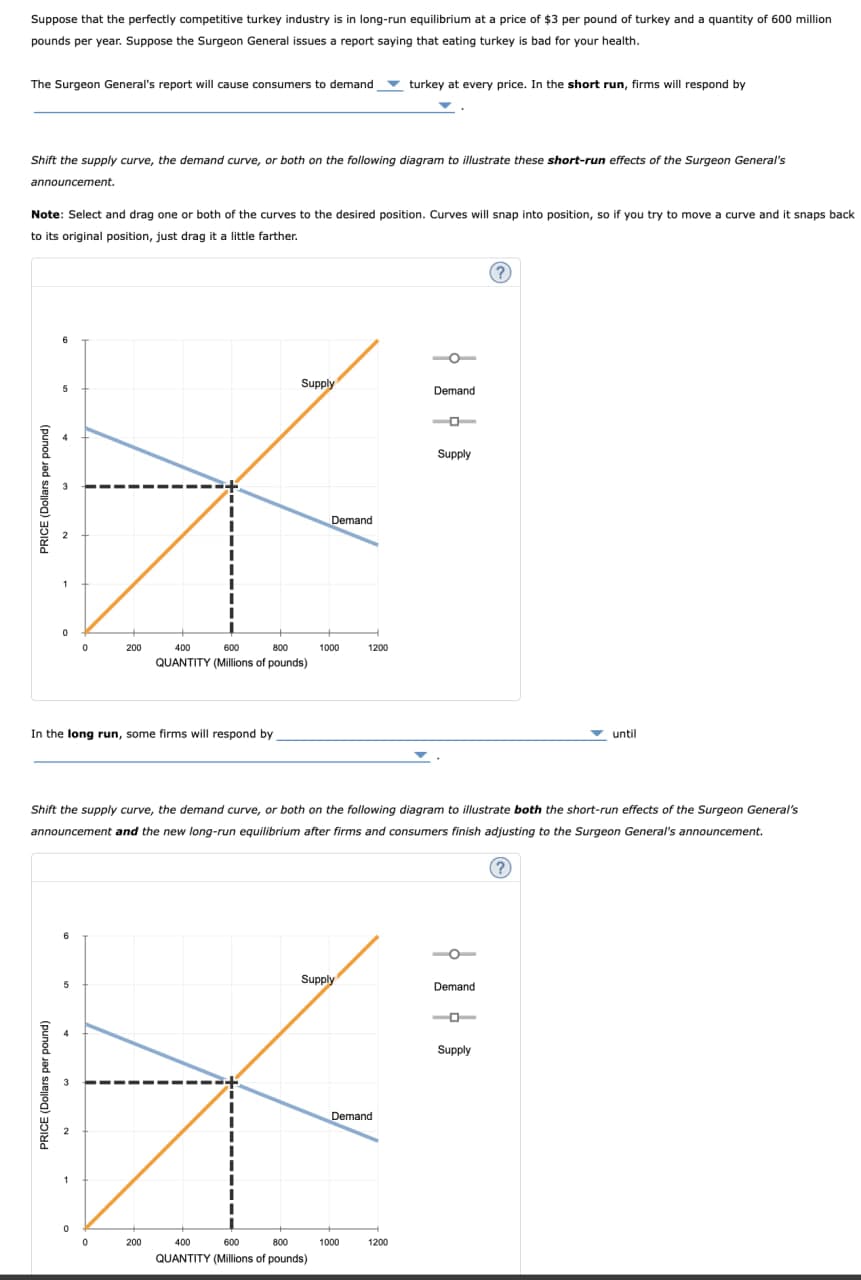
Suppose that the perfectly competitive turkey industry is in long-run equilibrium at a price of $3 per pound of turkey and a quantity of 600 million
pounds per year. Suppose the Surgeon General issues a report saying that eating turkey is bad for your health.
The Surgeon General's report will cause consumers to demand
turkey at every price. In the short run, firms will respond by
Shift the supply curve, the demand curve, or both on the following diagram to illustrate these short-run effects of the Surgeon General's
announcement.
Note: Select and drag one or both of the curves to the desired position. Curves will snap into position, so if you try to move a curve and it snaps back
to its original position, just drag it a little farther.
Supply
Demand
Demand
°
200
400
600
800
1000
1200
QUANTITY (Millions of pounds)
In the long run, some firms will respond by.
Supply
?
until
Shift the supply curve, the demand curve, or both on the following diagram to illustrate both the short-run effects of the Surgeon General's
announcement and the new long-run equilibrium after firms and consumers finish adjusting to the Surgeon General's announcement.
Supply
5
Demand
0
200
400
600
800
QUANTITY (Millions of pounds)
Demand
1000
1200
Supply
Expert Solution
This question has been solved!
Explore an expertly crafted, step-by-step solution for a thorough understanding of key concepts.

Step by step
Solved in 4 steps with 2 images

Knowledge Booster


Learn more about
Need a deep-dive on the concept behind this application? Look no further. Learn more about this topic, economics and related others by exploring similar questions and additional content below.Recommended textbooks for you
Managerial Economics: A Problem Solving Approach
Economics
ISBN:
9781337106665
Author:
Luke M. Froeb, Brian T. McCann, Michael R. Ward, Mike Shor
Publisher:
Cengage Learning

Principles of Economics 2e
Economics
ISBN:
9781947172364
Author:
Steven A. Greenlaw; David Shapiro
Publisher:
OpenStax
Managerial Economics: A Problem Solving Approach
Economics
ISBN:
9781337106665
Author:
Luke M. Froeb, Brian T. McCann, Michael R. Ward, Mike Shor
Publisher:
Cengage Learning
Principles of Economics 2e
Economics
ISBN:
9781947172364
Author:
Steven A. Greenlaw; David Shapiro
Publisher:
OpenStax