PRICE LEVEL Shift the appropriate curve on the graph to illustrate the impact of this change in government spending. REAL GDP (Trillions of dollars) AD AD AS AS The prescribed change in government spending will: Increase the price level and decrease real GDP Decrease the price level and move the economy toward full employment Move the economy toward full employment with no change in the price level ? PRICE LEVEL Complete the following table by matching the macroeconomic assumptions about aggregate supply to the appropriate school of thought. Assumption Keynesian Classical Product prices and production costs are flexible. Only an increase in aggregate demand can move an economy out of a recession and back to potential real GDP quickly. The following graph shows the aggregate demand (AD) and aggregate supply (AS) curves for a hypothetical economy that is currently operating below its full-employment output level. That is, the economy is currently in a recession. The aggregate supply curve (AS) in this diagram is consistent with the government should spending in response to the recession. view of aggregate supply. According to this viewpoint, the Shift the appropriate curve on the graph to illustrate the impact of this change in government spending. REAL GDP (Trillions of dollars) AD AD AS AS ?
PRICE LEVEL Shift the appropriate curve on the graph to illustrate the impact of this change in government spending. REAL GDP (Trillions of dollars) AD AD AS AS The prescribed change in government spending will: Increase the price level and decrease real GDP Decrease the price level and move the economy toward full employment Move the economy toward full employment with no change in the price level ? PRICE LEVEL Complete the following table by matching the macroeconomic assumptions about aggregate supply to the appropriate school of thought. Assumption Keynesian Classical Product prices and production costs are flexible. Only an increase in aggregate demand can move an economy out of a recession and back to potential real GDP quickly. The following graph shows the aggregate demand (AD) and aggregate supply (AS) curves for a hypothetical economy that is currently operating below its full-employment output level. That is, the economy is currently in a recession. The aggregate supply curve (AS) in this diagram is consistent with the government should spending in response to the recession. view of aggregate supply. According to this viewpoint, the Shift the appropriate curve on the graph to illustrate the impact of this change in government spending. REAL GDP (Trillions of dollars) AD AD AS AS ?

Macroeconomics: Principles and Policy (MindTap Course List)
13th Edition
ISBN:9781305280601
Author:William J. Baumol, Alan S. Blinder
Publisher:William J. Baumol, Alan S. Blinder
Chapter10: Bringing In The Supply Side: Unemployment And Inflation?
Section: Chapter Questions
Problem 3TY

Related questions
Question
Transcribed Image Text:PRICE LEVEL
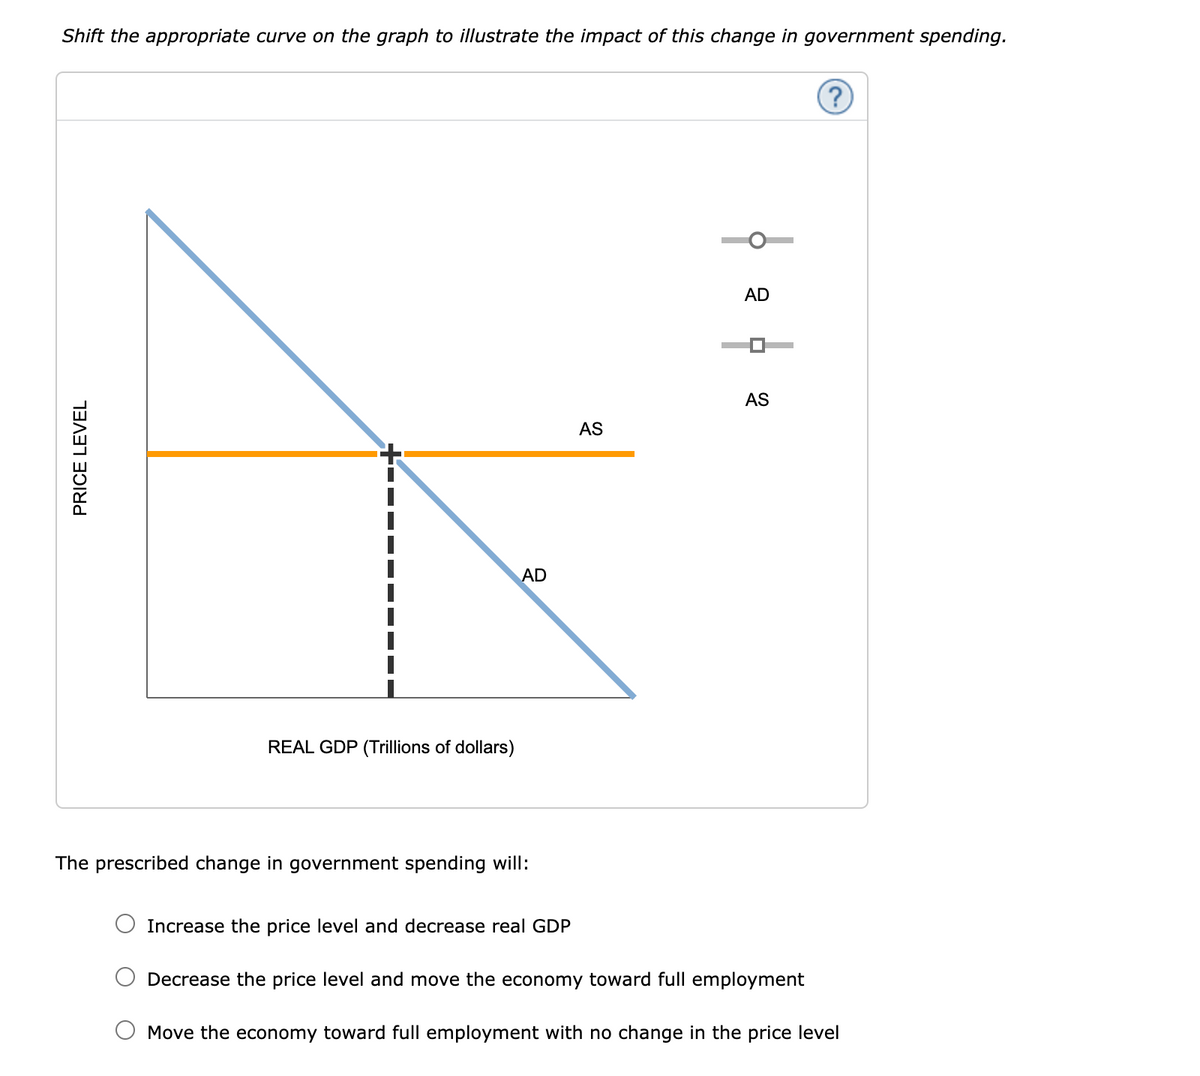
Shift the appropriate curve on the graph to illustrate the impact of this change in government spending.
REAL GDP (Trillions of dollars)
AD
AD
AS
AS
The prescribed change in government spending will:
Increase the price level and decrease real GDP
Decrease the price level and move the economy toward full employment
Move the economy toward full employment with no change in the price level
?
Transcribed Image Text:PRICE LEVEL
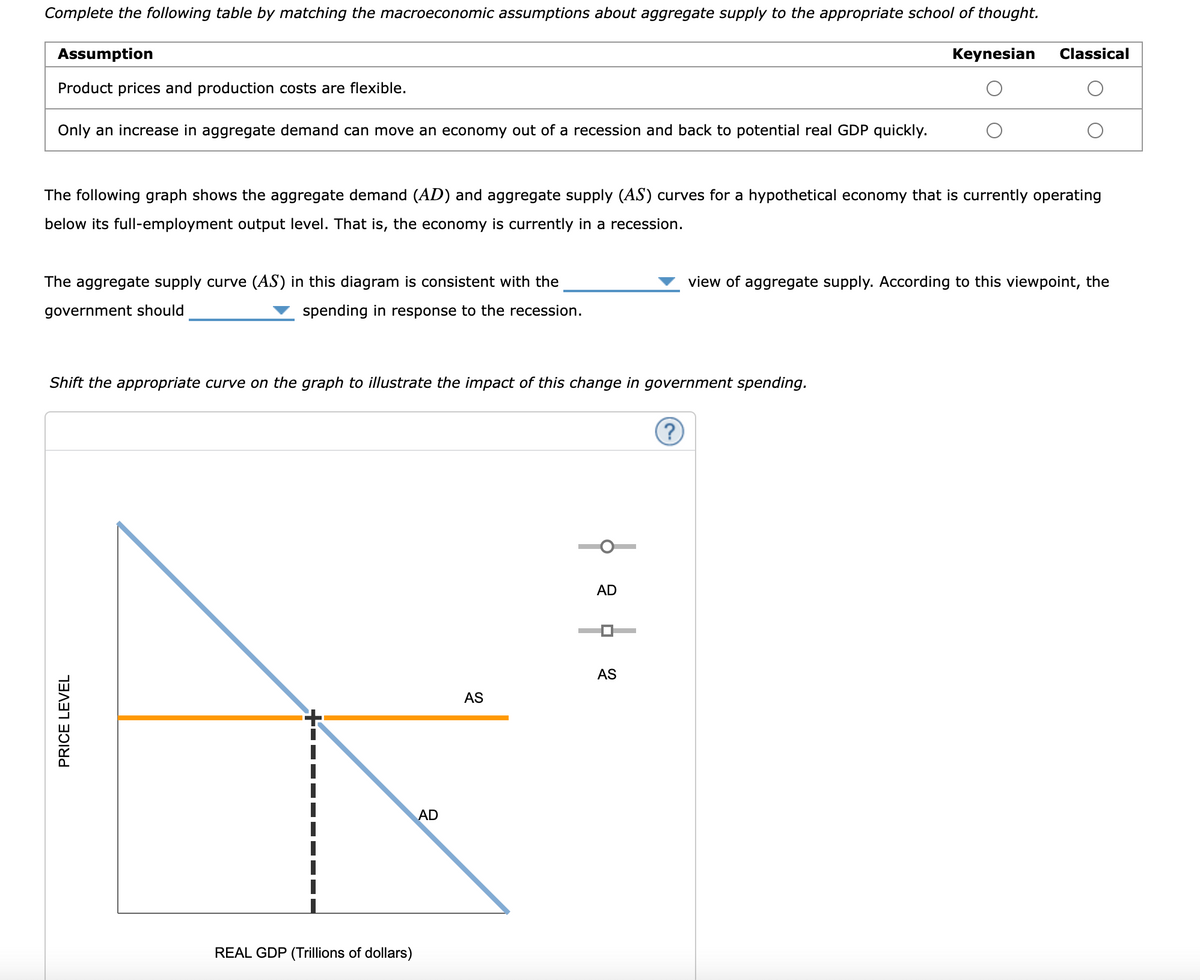
Complete the following table by matching the macroeconomic assumptions about aggregate supply to the appropriate school of thought.
Assumption
Keynesian
Classical
Product prices and production costs are flexible.
Only an increase in aggregate demand can move an economy out of a recession and back to potential real GDP quickly.
The following graph shows the aggregate demand (AD) and aggregate supply (AS) curves for a hypothetical economy that is currently operating
below its full-employment output level. That is, the economy is currently in a recession.
The aggregate supply curve (AS) in this diagram is consistent with the
government should
spending in response to the recession.
view of aggregate supply. According to this viewpoint, the
Shift the appropriate curve on the graph to illustrate the impact of this change in government spending.
REAL GDP (Trillions of dollars)
AD
AD
AS
AS
?
Expert Solution
This question has been solved!
Explore an expertly crafted, step-by-step solution for a thorough understanding of key concepts.

This is a popular solution!

Trending now
This is a popular solution!

Step by step
Solved in 1 steps with 1 images

Recommended textbooks for you
Macroeconomics: Principles and Policy (MindTap Co…
Economics
ISBN:
9781305280601
Author:
William J. Baumol, Alan S. Blinder
Publisher:
Cengage Learning


Macroeconomics: Principles and Policy (MindTap Co…
Economics
ISBN:
9781305280601
Author:
William J. Baumol, Alan S. Blinder
Publisher:
Cengage Learning


Principles of Economics 2e
Economics
ISBN:
9781947172364
Author:
Steven A. Greenlaw; David Shapiro
Publisher:
OpenStax