The following is the graph of the natural log of UK real GDP per capita between 1875 and 2014: Based on this information, which of the following statements is correct? Log of real GDP per capita 11.0 10.5 10.0 95 9.0 8.5 8.0 75 ა C Year Show Transcribed Text y-0.0156x 7.7734 R-0.9445 (A) The graph shows that real GDP per capita in the UK in 1955 was about £8,000. (B) The slope of the best-fit straight line is the average annual growth rate. (C) The graph shows that the average growth rate was lower in the decades after 1921 than in the decades before 1918. (D) The graph of real GDP per capita plotted using a ratio scale would look very different to the graph above.
The following is the graph of the natural log of UK real GDP per capita between 1875 and 2014: Based on this information, which of the following statements is correct? Log of real GDP per capita 11.0 10.5 10.0 95 9.0 8.5 8.0 75 ა C Year Show Transcribed Text y-0.0156x 7.7734 R-0.9445 (A) The graph shows that real GDP per capita in the UK in 1955 was about £8,000. (B) The slope of the best-fit straight line is the average annual growth rate. (C) The graph shows that the average growth rate was lower in the decades after 1921 than in the decades before 1918. (D) The graph of real GDP per capita plotted using a ratio scale would look very different to the graph above.

Chapter19: Measuring Economic Performance
Section: Chapter Questions
Problem 1P

Related questions
Question
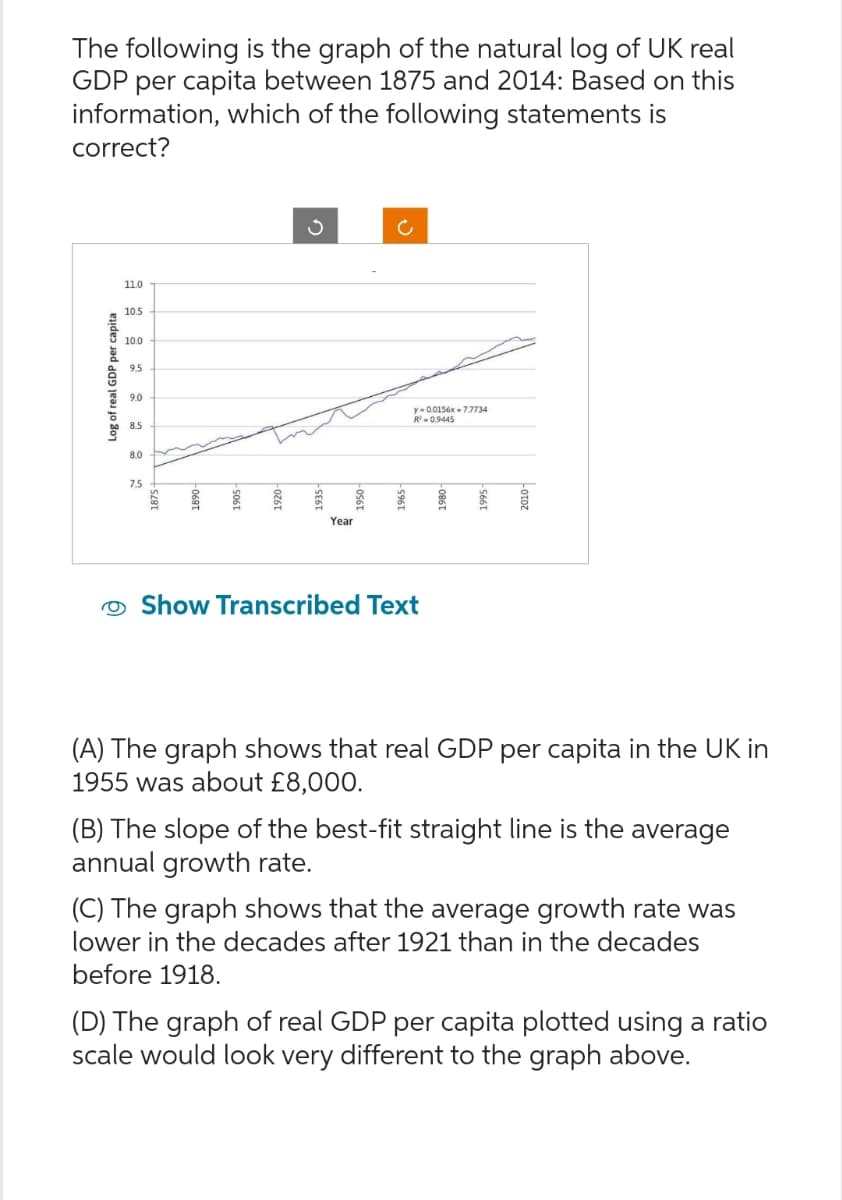
Transcribed Image Text:The following is the graph of the natural log of UK real
GDP per capita between 1875 and 2014: Based on this
information, which of the following statements is
correct?
Log of real GDP per capita
11.0
10.5
10.0
9.5
9.0
8.5
8.0
7.5
-068T
ა
c
Year
Show Transcribed Text
y-0.0156x 7.7734
R-0.9445
(A) The graph shows that real GDP per capita in the UK in
1955 was about £8,000.
(B) The slope of the best-fit straight line is the average
annual growth rate.
(C) The graph shows that the average growth rate was
lower in the decades after 1921 than in the decades
before 1918.
(D) The graph of real GDP per capita plotted using a ratio
scale would look very different to the graph above.
Expert Solution
This question has been solved!
Explore an expertly crafted, step-by-step solution for a thorough understanding of key concepts.

Step by step
Solved in 4 steps

Knowledge Booster


Learn more about
Need a deep-dive on the concept behind this application? Look no further. Learn more about this topic, economics and related others by exploring similar questions and additional content below.Recommended textbooks for you
Exploring Economics
Economics
ISBN:
9781544336329
Author:
Robert L. Sexton
Publisher:
SAGE Publications, Inc

Brief Principles of Macroeconomics (MindTap Cours…
Economics
ISBN:
9781337091985
Author:
N. Gregory Mankiw
Publisher:
Cengage Learning

Essentials of Economics (MindTap Course List)
Economics
ISBN:
9781337091992
Author:
N. Gregory Mankiw
Publisher:
Cengage Learning
Exploring Economics
Economics
ISBN:
9781544336329
Author:
Robert L. Sexton
Publisher:
SAGE Publications, Inc
Brief Principles of Macroeconomics (MindTap Cours…
Economics
ISBN:
9781337091985
Author:
N. Gregory Mankiw
Publisher:
Cengage Learning
Essentials of Economics (MindTap Course List)
Economics
ISBN:
9781337091992
Author:
N. Gregory Mankiw
Publisher:
Cengage Learning


Principles of Economics 2e
Economics
ISBN:
9781947172364
Author:
Steven A. Greenlaw; David Shapiro
Publisher:
OpenStax