Price MC, =S Ds D Quantity Figure 10 Demand and supply curves Towards the right of Figure 10 are two circular red markers with a line between them that you can use to draw a MCp – subsidy curve on Figure 10. You can move the markers with the mouse by clicking on them and dragging. Alternatively, you can tab to each marker and then use the keyboard arrow keys. A report from Cycling England has suggested that a £70m investment in cycling each year could save the government £520m per year. The savings result from the positive benefits of increased cycling - lower carbon dioxide emissions and lower NHS costs as we become healthier. These positive consumption externalities are shown in the diagram below by the demand curve Ds. This is the level of demand society would prefer at each price once the externalities are recognised. The government decides to subsidise the production of bikes to encourage consumption of cycling. Move the markers to drag the line to the correct place on the diagram to show how a producer subsidy can lead to the socially optimal level of cycling.
Price MC, =S Ds D Quantity Figure 10 Demand and supply curves Towards the right of Figure 10 are two circular red markers with a line between them that you can use to draw a MCp – subsidy curve on Figure 10. You can move the markers with the mouse by clicking on them and dragging. Alternatively, you can tab to each marker and then use the keyboard arrow keys. A report from Cycling England has suggested that a £70m investment in cycling each year could save the government £520m per year. The savings result from the positive benefits of increased cycling - lower carbon dioxide emissions and lower NHS costs as we become healthier. These positive consumption externalities are shown in the diagram below by the demand curve Ds. This is the level of demand society would prefer at each price once the externalities are recognised. The government decides to subsidise the production of bikes to encourage consumption of cycling. Move the markers to drag the line to the correct place on the diagram to show how a producer subsidy can lead to the socially optimal level of cycling.

Essentials of Economics (MindTap Course List)
8th Edition
ISBN:9781337091992
Author:N. Gregory Mankiw
Publisher:N. Gregory Mankiw
Chapter6: Supply, Demand And Government Policies
Section: Chapter Questions
Problem 2PA

Related questions
Question
Transcribed Image Text:Price
MC, =S
Ds
D
Quantity
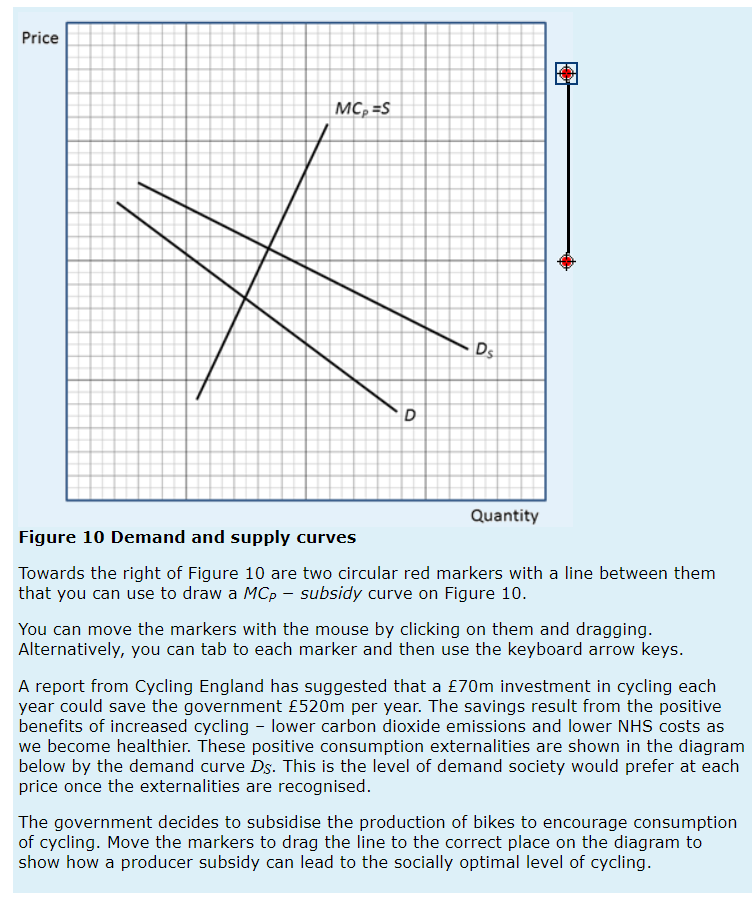
Figure 10 Demand and supply curves
Towards the right of Figure 10 are two circular red markers with a line between them
that you can use to draw a MCp – subsidy curve on Figure 10.
You can move the markers with the mouse by clicking on them and dragging.
Alternatively, you can tab to each marker and then use the keyboard arrow keys.
A report from Cycling England has suggested that a £70m investment in cycling each
year could save the government £520m per year. The savings result from the positive
benefits of increased cycling - lower carbon dioxide emissions and lower NHS costs as
we become healthier. These positive consumption externalities are shown in the diagram
below by the demand curve Ds. This is the level of demand society would prefer at each
price once the externalities are recognised.
The government decides to subsidise the production of bikes to encourage consumption
of cycling. Move the markers to drag the line to the correct place on the diagram to
show how a producer subsidy can lead to the socially optimal level of cycling.
Expert Solution
This question has been solved!
Explore an expertly crafted, step-by-step solution for a thorough understanding of key concepts.

Step by step
Solved in 2 steps with 1 images

Knowledge Booster


Learn more about
Need a deep-dive on the concept behind this application? Look no further. Learn more about this topic, economics and related others by exploring similar questions and additional content below.Recommended textbooks for you
Essentials of Economics (MindTap Course List)
Economics
ISBN:
9781337091992
Author:
N. Gregory Mankiw
Publisher:
Cengage Learning

Principles of Economics 2e
Economics
ISBN:
9781947172364
Author:
Steven A. Greenlaw; David Shapiro
Publisher:
OpenStax

Principles of Macroeconomics (MindTap Course List)
Economics
ISBN:
9781305971509
Author:
N. Gregory Mankiw
Publisher:
Cengage Learning
Essentials of Economics (MindTap Course List)
Economics
ISBN:
9781337091992
Author:
N. Gregory Mankiw
Publisher:
Cengage Learning
Principles of Economics 2e
Economics
ISBN:
9781947172364
Author:
Steven A. Greenlaw; David Shapiro
Publisher:
OpenStax
Principles of Macroeconomics (MindTap Course List)
Economics
ISBN:
9781305971509
Author:
N. Gregory Mankiw
Publisher:
Cengage Learning


Exploring Economics
Economics
ISBN:
9781544336329
Author:
Robert L. Sexton
Publisher:
SAGE Publications, Inc