Price Price Panel (a) D₁ S₁ Price Panel (b) Price D₁ Panel (d) Quantity Panel (c) S₁ X D₁ D₁ 0₂ Quantity Quantity Figure 3 a. Refer to Figure 3. Assume that the graphs in this figure represent the demand and supply curves for women's clothing. Which panel best describes what happens in this market when the wages of seamstresses rise? b. Refer to Figure 3. Assume that the graphs in this figure represent the demand and supply curves for almonds. Which panel best describes what happens in this market when there is an increase in the productivity of almond harvesters? C. Refer to Figure 3. Assume that the graphs in this figure represent the demand and supply curves for Fruitopia, a soft drink. Which panel describes what happens in the market for Fruitopia when the price of Snapple, a substitute product, decreases? d. Refer to Figure 3. Assume that the graphs in this figure represent the demand and supply curves for potatoes and that steak and potatoes are complements. What panel describes what happens in this market when the price of steak rises? e. Refer to Figure 3. Assume that the graphs in this figure represent the demand and supply curves for rice. What happens in this market if buyers expect the price of rice to fall? : Investigate D₂ Styles S₁ S₁ Quantity
Price Price Panel (a) D₁ S₁ Price Panel (b) Price D₁ Panel (d) Quantity Panel (c) S₁ X D₁ D₁ 0₂ Quantity Quantity Figure 3 a. Refer to Figure 3. Assume that the graphs in this figure represent the demand and supply curves for women's clothing. Which panel best describes what happens in this market when the wages of seamstresses rise? b. Refer to Figure 3. Assume that the graphs in this figure represent the demand and supply curves for almonds. Which panel best describes what happens in this market when there is an increase in the productivity of almond harvesters? C. Refer to Figure 3. Assume that the graphs in this figure represent the demand and supply curves for Fruitopia, a soft drink. Which panel describes what happens in the market for Fruitopia when the price of Snapple, a substitute product, decreases? d. Refer to Figure 3. Assume that the graphs in this figure represent the demand and supply curves for potatoes and that steak and potatoes are complements. What panel describes what happens in this market when the price of steak rises? e. Refer to Figure 3. Assume that the graphs in this figure represent the demand and supply curves for rice. What happens in this market if buyers expect the price of rice to fall? : Investigate D₂ Styles S₁ S₁ Quantity

Chapter1: Introducing The Economic Way Of Thinking
Section1.A: Applying Graphs To Economics
Problem 2SQP

Related questions
Question
Transcribed Image Text:Price
Panel (a)
Panel (b)
Z
D₁
Quantity
Quantity
Panel (c)
Panel (d)
XX
Quantity
Quantity
Figure 3
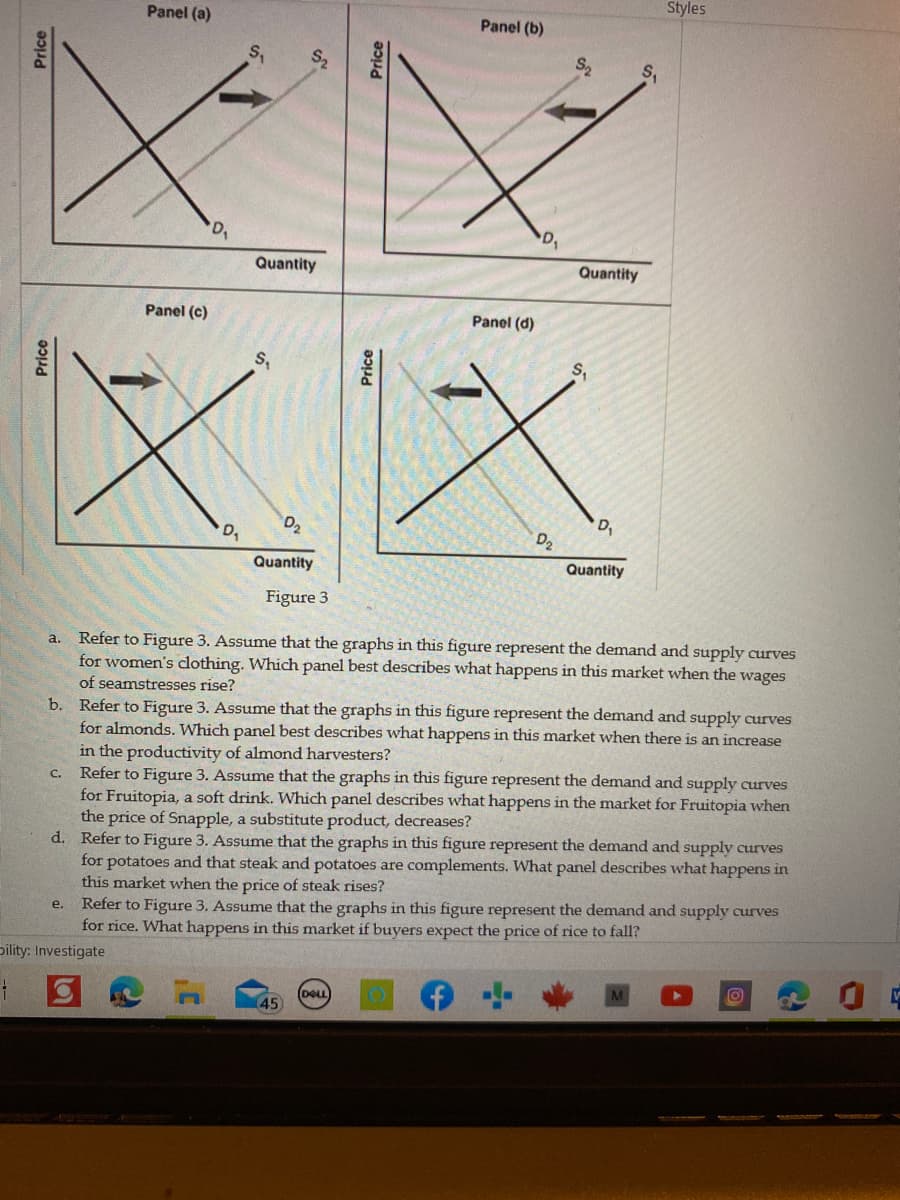
a.
Refer to Figure 3. Assume that the graphs in this figure represent the demand and supply curves
for women's clothing. Which panel best describes what happens in this market when the wages
of seamstresses rise?
b.
Refer to Figure 3. Assume that the graphs in this figure represent the demand and supply curves
for almonds. Which panel best describes what happens in this market when there is an increase
in the productivity of almond harvesters?
c. Refer to Figure 3. Assume that the graphs in this figure represent the demand and supply curves
for Fruitopia, a soft drink. Which panel describes what happens in the market for Fruitopia when
the price of Snapple, a substitute product, decreases?
d. Refer to Figure 3. Assume that the graphs in this figure represent the demand and supply curves
for potatoes and that steak and potatoes are complements. What panel describes what happens in
this market when the price of steak rises?
e. Refer to Figure 3. Assume that the graphs in this figure represent the demand and supply curves
for rice. What happens in this market if buyers expect the price of rice to fall?
Dility: Investigate
O
1
(DELL
45
Price
'D₁
S₁
5
Price
Styles
Price
Expert Solution
This question has been solved!
Explore an expertly crafted, step-by-step solution for a thorough understanding of key concepts.

This is a popular solution!

Trending now
This is a popular solution!

Step by step
Solved in 2 steps

Knowledge Booster


Learn more about
Need a deep-dive on the concept behind this application? Look no further. Learn more about this topic, economics and related others by exploring similar questions and additional content below.Recommended textbooks for you


Principles of Economics 2e
Economics
ISBN:
9781947172364
Author:
Steven A. Greenlaw; David Shapiro
Publisher:
OpenStax
