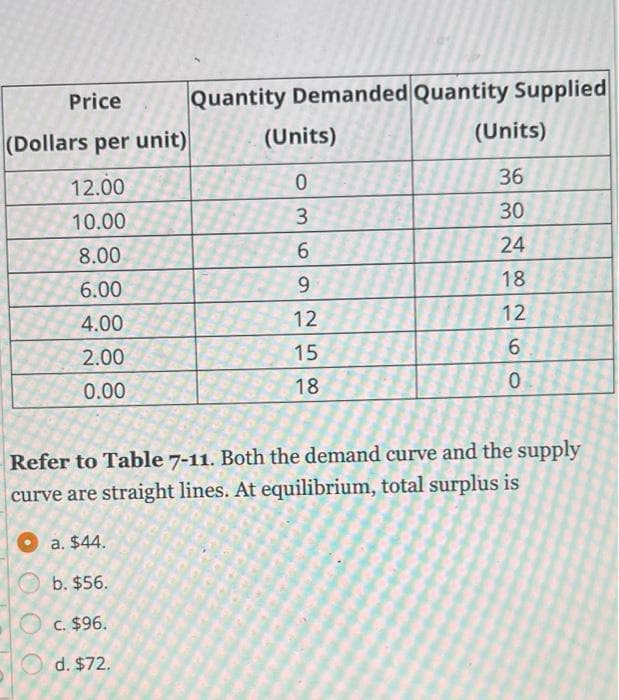
Price Quantity Demanded Quantity Supplied Dollars per unit) (Units) (Units) 36 12.00 10.00 3 30 8.00 6. 24 6.00 9. 18 12 12 4.00 2.00 15 0.00 18 Refer to Table 7-11. Both the demand curve and the supply curve are straight lines. At equilibrium, total surplus is O a. $44. O b. $56. O c. $96. d. $72.


Q: apital equipment per worker ($ thousands) g statements are correct? e function is the marginal produ...
A: *Answer: Correct options are a) and b) °The marginal product of capital is the additional output th...
Q: entrepreneurs, freedom, opportunity, and a little bit of money are to economic growth and prosperity...
A: The correct answer is given in the second step.
Q: Suppose an economy has an MPC = 0.875. 1. If government spending increase by $100, how much wi...
A: In economics, the marginal propensity to consume is a metric that quantifies induced consumption, th...
Q: Consider a pair of Nike shoes. Is the consumption of Nike shoes rival and excludable? The consumptio...
A: Rival : means consuming a good by one person, lefts nothing for other. Excludable: if someone is not...
Q: The discount rate when the net present value of a project is zero is called the rate of return margi...
A: The answer is as follow :
Q: A company sells an item for P10 each. If the manufacturing cost is P60k per month and the labor is P...
A: Break even point (units)=Fixed costSells per unit - Variable cost per unit Here, Fixed cost = 60,000...
Q: All else being equal, a country whose currency has declined in value from year to year is likely to:...
A: The economics as a study is based upon the general idea that the resources which are present with th...
Q: consider the money market model, price of a potato chips and the real wage. Suppose that the central...
A: Money neutrality says that the change in the amount of MS (money supply) in an economy affects only ...
Q: There are two people: Brandon, who is really, really good at cleaning front yards and mowing lawns; ...
A: Let us prepare the matrix of the given information Cleaning Front Yard (C) Mowing Lawn (M) Br...
Q: B/ Consider the Open Economy with Government Participation (i.e. the Mixed Economy): Planned Expendi...
A: Dear student, you have asked multiple sub-part questions in a single post.In such a case, I will be ...
Q: Use the World View to answer the questions. Be sure to spell the country correctly. WORLD VIEW Com...
A: Inflation: When price increases at a continuous rate then this can be considered inflation, when inf...
Q: A plane carrying food and water to a resort island can carry a maximum of 27000 pounds and is limite...
A:
Q: If the price of catfish changed from $13 to $14 per bushel, determine the Assessment Tool iFrame Ins...
A: When price increases from $13 to $14:- Number of bushels Price Total Revenue Total Cost Total Pr...
Q: Suppose an amusement park lowere the price of admission. If the demand for admission is elavtic, the...
A: The measure that depicts percentage change in quantity being demanded with respect to percentage cha...
Q: Describe Locke's labor theory of property. (What is his fundamental hypothesis? How much of value do...
A: When studying economics, it can be seen that many economists gave their theory to explain the nature...
Q: 1. Welfare effects of free trade in an exporting country Consider the Bolivian market for lemons. Th...
A: Equilibrium occurs at the intersection of demand and supply Consumer surplus is the area above the p...
Q: Which of the following statements is true Select one: a. If economic profit is negative, accounting ...
A: Accounting profit is the difference between TR (total revenue) and TC(total cost). Economic profit, ...
Q: A government official announces a new policy. The country wishes to eliminate its trade deficit, but...
A: An administration official declares another strategy. The goal is to take out its import/export imba...
Q: explain what is meant by intermediate products and the role they play in the production function
A: Consumer goods are those goods which are purchased by the consumers for direct consumption and satis...
Q: 5. We have 5 groups of consumers on potato market. According to the table calculate total market dem...
A:
Q: Al its current short-run evel of production, a irm's average variable costs equal $30 per unit, nd i...
A: Fixed cost is independent of output produced whereas variable cost varies with the level of producti...
Q: Suppose that autonomous consumption is 1,500, government purchases are 500, planned investment spend...
A: We can find the equilibrium GDP by the following formula: Y = C + I + G + NX where, Y is equilibriu...
Q: Why GDP is criticized as a “deeply foolish” indicator of how an economy? What are the different acti...
A: The measure that depicts the total value of goods and services that are being produced in an economy...
Q: American corporations have in recent years turned to thepractices of downsizing and contingent emplo...
A: Considering the scenario, an economy facing a downturn or recession will choose to downsize its empl...
Q: If the nominal interest rate is 7%, inflation is 4%, and the risk premium is 1.5%, what is the MP cu...
A: Let's show concider given Nominal interest rate = 7% Inflation = 4 Answer and explanation given...
Q: Assume that the most efficient production technology available for making vitamin pills has the cost...
A: "Average total cost (ATC) is the cost per unit of the output produced and this is computed by dividi...
Q: The __________ is the belief that work is an obligation and that capital should be reinvested for fu...
A: The purpose of investing is the generation of return or income from an asset that is being invested ...
Q: When there is a calamity, the government provides help either in the form of food or cash. Which wou...
A: Cash grants and subsidies are two of the many types of help that are provided by the government to i...
Q: The chart below shows a real wage index in England between 1260 and 1800. Figure 2.16: Real wages pr...
A: The below graph shows real wage index in England between 1260 and 1800. The Black Death, a catast...
Q: 19. If a low cost house and lot worth 87,000 were offered at 10% down payment and 500 per month for ...
A: EIR, effective annual interest rate (AER), annual equivalent rate (AER), or simply effective rate is...
Q: Explain Keynes’s theory of investment and why it is central to his more general theory of output and...
A: Mistrust of the rationality of free-market decision making pervades the atmosphere. A book by Englis...
Q: Given the following regression model y = B, + B,x, +u, Where N = 60 Ut P1ut-1 + Et
A: Unit root test is used to find the trend and stationary in the time series data. There are 3 types o...
Q: increase in al O a. Price level incases. O b. Real GDP and price level increase. O c. Interest rates...
A: DISCLAIMER “Since you have asked multiple question, we will solve the first question for you. If yo...
Q: 4 In the case of a median exchange, chips can be used by both the buyer and the seller, with the sel...
A: Money supply is defined as the total amount of money available in the economy at any given time. It ...
Q: Suppose that the world demand and supply elasticities of crude oil are -0.906 and 0.515, respectivel...
A: Solution:- 1) If the demand curve is linear, it is in the form of QD = a + bP Also, we know that Ed...
Q: That the free flow of goods and capital creates economies of scale is not necessarily a good thing. ...
A: Externality refers to the effects caused by an activity over its surrounding or environment. These e...
Q: 2. Given: Q 100K".“L08; w = 50; r = 80; Qo = 2,000 w a. Solve for the MRTSK and the market rate of e...
A: Answer is given below...
Q: 11. (Originally #7 on Homework #3) Consider a consumer with the following information: At the optima...
A: Consumer equilibrium is the equilibrium that is achieved where the budget line is equal to the margi...
Q: 6. What will be the new short-run equilibrium Real GDP in this case? Are we in an inflationary gap o...
A: Output gap is the difference between potential output and actual equilibrium output.
Q: F G H 1 6. 3 6. 3 A 8 5 B 3 3 4 2 4 9. C 3 a.) Find all pure-strategy Nash equilibria of the above g...
A:
Q: Three former Uruguayan presidents recommended the current administration that without abandoning Mer...
A: Mercosur was created in 1991 as a procedural and economic group that was open and active. Since its ...
Q: Philippine Society of Civil Engineers is planning to put up its own building, and two proposals (5-y...
A: Computing the following: 1. Equivalent present cost of Proposal A. 2. Equivalent present cost of Pro...
Q: ompensaton of Emplyees anunplon of Fred Capta ros investment nts erest aperts pots rporate Prts es o...
A: The gross domestic product minus depreciation on a country's capital goods equals the net domestic p...
Q: Answer this question for me mate. Much appreciated. :)
A: Government is the central government that increases the expenditure or taxes on an economy. It means...
Q: 10. Which of the two curves would Keynesians believe is more likely to be the case? Which is more in...
A: Keynesian economists and monetarists have different opinions about the demand for money's sensitivit...
Q: refute this statement with reasons The government should impede the pace of innovation, whic...
A: here we answer this given as follow;
Q: Given a competitive market equilibrium with normal supply and demand curves: Select one or more: O a...
A:
Q: Which of the following is ot a benefit of budgeting? It is a basis for performance evaluation. It as...
A: The correct answer is D. It deters waste It is not the benefit of budgeting because budgeting is d...
Q: aggregate demand for coffee is D(p) = 10 - (3/4)p and the aggregate supply S(p) = 5p then what is th...
A: As given Aggregate Demand D(p) = 10-(3/4)p Aggregate Supply S(p) = 5p
Q: What are the seven economic growth facts?
A:


Trending now
This is a popular solution!

Step by step
Solved in 2 steps


- Please answer part (D). 1. Much of the demand for U.S. agricultural output comes from other countries. Suppose that the total demand for wheat in the U.S. wheat market is QDT = 3,244 – 283P, where P is the price measured in dollars per bushel and Q is the quantity of wheat expressed in millions of bushels per year. Of the total demand, total domestic demand was QD,US = 1,700 – 107P. Total supply of wheat in the U.S. market is QST = 1,944 + 207P. As a result of the ongoing trade war with China, suppose the export demand for wheat falls by 40 percent. a. U.S. farmers are concerned about this drop in export demand. How does this drop in export demand impact the market price of wheat in the U.S.? Do farmers have much reason to worry? Explain/support your answer. b. How does the reduction in export demand affect U.S. consumer surplus in the wheat market? Illustrate and explain. c. Now, suppose the U.S. government wants to buy enough wheat to raise the price to $3.50 per bushel. With…A4 Suppose that good X is traded in a competitive market. The market clearing price is $25.00 and the quantity supplied is 200. A proposed change in government policy is expected to cause the market price to increase by $1.50. Previous studies suggest that the price elasticity of supply is about 1.5. Assuming the supply schedule is linear, calculate the change in producer surplus from the government's policy shift. Round your answer to 1 decimal place and report it in the box below. Don't include the dollar sign, but if producer surplus decreases, be sure to include a negative sign in your response. your answer isThe market for pizza has the following demand and supply schedules: Price Quantity Demanded Quantity Supplied (Dollars) (Pizzas) (Pizzas) 4 135 26 5 104 53 6 81 81 7 68 98 8 53 110 9 39 121 If the actual price in this market were $7, quantity supplied would be than quantity demanded, so there would be pressure on prices. If the actual price in this market were below the equilibrium price, suppliers raise the price without losing sales.
- Milk is flowing like never before in the U.S., where dairies have expanded output enough to send wholesale prices plunging from an all-time high in September. Production in the 12 months through October reached 17.08 billion pounds a month on average, up 1.8 percent from the same period a year earlier, as farmers took advantage of high milk prices and low livestock-feed costs, government data show. Two years of record corn harvests in the U.S. sent grain prices to a five-year low. Grains are mainly used as feed for cow farmers. Imports of milk to the US has also increased during the period as countries such as New Zealand are also benefiting from good market conditions During this time however, demand for the good has not been able to keep up with the supply. Notably, the current market conditions are not expected to last with impending drought conditions that would impact the harvest of corn and result in an increase in its price. With higher prices for grains some farmers may no…Milk is flowing like never before in the U.S., where dairies have expanded output enough to send wholesale prices plunging from an all-time high in September. Production in the 12 months through October reached 17.08 billion pounds a month on average, up 1.8 percent from the same period a year earlier, as farmers took advantage of high milk prices and low livestock-feed costs, government data show. Two years of record corn harvests in the U.S. sent grain prices to a five-year low. Grains are mainly used as feed for cow farmers. Imports of milk to the US has also increased during the period as countries such as New Zealand are also benefiting from good market conditions During this time however, demand for the good has not been able to keep up with the supply. Notably, the current market conditions are not expected to last with impending drought conditions that would impact the harvest of corn and result in an increase in its price. With higher prices for grains some farmers may no…Milk is flowing like never before in the U.S., where dairies have expanded output enough to send wholesale prices plunging from an all-time high in September. Production in the 12 months through October reached 17.08 billion pounds a month on average, up 1.8 percent from the same period a year earlier, as farmers took advantage of high milk prices and low livestock-feed costs, government data show. Two years of record corn harvests in the U.S. sent grain prices to a five-year low. Grains are mainly used as feed for cow farmers. Imports of milk to the US has also increased during the period as countries such as New Zealand are also benefiting from good market conditions During this time however, demand for the good has not been able to keep up with the supply.Notably, the current market conditions are not expected to last with impending drought conditions that would impact the harvest of corn and result in an increase in its price. With higher prices for grains some farmers may no…
- Milk is flowing like never before in the U.S., where dairies have expanded output enough to send wholesale prices plunging from an all-time high in September. Production in the 12 months through October reached 17.08 billion pounds a month on average, up 1.8 percent from the same period a year earlier, as farmers took advantage of high milk prices and low livestock-feed costs, government data show. Two years of record corn harvests in the U.S. sent grain prices to a five-year low. Grains are mainly used as feed for cow farmers. Imports of milk to the US has also increased during the period as countries such as New Zealand are also benefiting from good market conditions During this time however, demand for the good has not been able to keep up with the supply. Notably, the current market conditions are not expected to last with impending drought conditions that would impact the harvest of corn and result in an increase in its price. With higher prices for grains some farmers may no…Milk is flowing like never before in the U.S., where dairies have expanded output enough to send wholesale prices plunging from an all-time high in September. Production in the 12 months through October reached 17.08 billion pounds a month on average, up 1.8 percent from the same period a year earlier, as farmers took advantage of high milk prices and low livestock-feed costs, government data show. Two years of record corn harvests in the U.S. sent grain prices to a five-year low. Grains are mainly used as feed for cow farmers. Imports of milk to the US has also increased during the period as countries such as New Zealand are also benefiting from good market conditions During this time however, demand for the good has not been able to keep up with the supply. Notably, the current market conditions are not expected to last with impending drought conditions that would impact the harvest of corn and result in an increase in its price. With higher prices for grains some farmers may no…Milk is flowing like never before in the U.S., where dairies have expanded output enough to send wholesale prices plunging from an all-time high in September. Production in the 12 months through October reached 17.08 billion pounds a month on average, up 1.8 percent from the same period a year earlier, as farmers took advantage of high milk prices and low livestock-feed costs, government data show. Two years of record corn harvests in the U.S. sent grain prices to a five-year low. Grains are mainly used as feed for cow farmers. Imports of milk to the US has also increased during the period as countries such as New Zealand are also benefiting from good market conditions During this time however, demand for the good has not been able to keep up with the supply.Notably, the current market conditions are not expected to last with impending drought conditions that would impact the harvest of corn and result in an increase in its price. With higher prices for grains some farmers may no…
- Milk is flowing like never before in the U.S., where dairies have expanded output enough to send wholesale prices plunging from an all-time high in September. Production in the 12 months through October reached 17.08 billion pounds a month on average, up 1.8 percent from the same period a year earlier, as farmers took advantage of high milk prices and low livestock-feed costs, government data show. Two years of record corn harvests in the U.S. sent grain prices to a five-year low. Grains are mainly used as feed for cow farmers. Imports of milk to the US has also increased during the period as countries such as New Zealand are also benefiting from good market conditions During this time however, demand for the good has not been able to keep up with the supply. Notably, the current market conditions are not expected to last with impending drought conditions that would impact the harvest of corn and result in an increase in its price. With higher prices for grains some farmers may no…Milk is flowing like never before in the U.S., where dairies have expanded output enough to send wholesale prices plunging from an all-time high in September. Production in the 12 months through October reached 17.08 billion pounds a month on average, up 1.8 percent from the same period a year earlier, as farmers took advantage of high milk prices and low livestock-feed costs, government data show. Two years of record corn harvests in the U.S. sent grain prices to a five-year low. Grains are mainly used as feed for cow farmers. Imports of milk to the US has also increased during the period as countries such as New Zealand are also benefiting from good market conditions During this time however, demand for the good has not been able to keep up with the supply. Notably, the current market conditions are not expected to last with impending drought conditions that would impact the harvest of corn and result in an increase in its price. With higher prices for grains some farmers may no…Milk is flowing like never before in the U.S., where dairies have expanded output enough to send wholesale prices plunging from an all-time high in September. Production in the 12 months through October reached 17.08 billion pounds a month on average, up 1.8 percent from the same period a year earlier, as farmers took advantage of high milk prices and low livestock-feed costs, government data show. Two years of record corn harvests in the U.S. sent grain prices to a five-year low. Grains are mainly used as feed for cow farmers. Imports of milk to the US has also increased during the period as countries such as New Zealand are also benefiting from good market conditions During this time however, demand for the good has not been able to keep up with the supply. Notably, the current market conditions are not expected to last with impending drought conditions that would impact the harvest of corn and result in an increase in its price. With higher prices for grains some farmers may no…