Probability d. What proportion of the samples will have a mean useful life between 36.5 and 38.5 hours? Probability
Probability d. What proportion of the samples will have a mean useful life between 36.5 and 38.5 hours? Probability

Glencoe Algebra 1, Student Edition, 9780079039897, 0079039898, 2018
18th Edition
ISBN:9780079039897
Author:Carter
Publisher:Carter
Chapter10: Statistics
Section10.4: Distributions Of Data
Problem 7PPS

Related questions
Question
please solve only d part
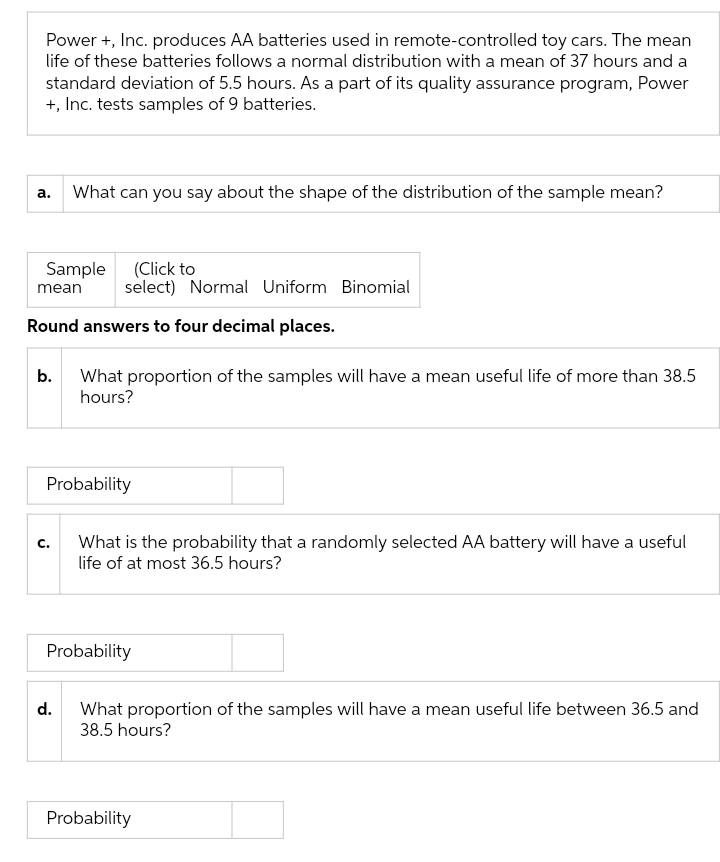
Transcribed Image Text:Power +, Inc. produces AA batteries used in remote-controlled toy cars. The mean
life of these batteries follows a normal distribution with a mean of 37 hours and a
standard deviation of 5.5 hours. As a part of its quality assurance program, Power
+, Inc. tests samples of 9 batteries.
а.
What can you say about the shape of the distribution of the sample mean?
Sample (Click to
mean
select) Normal Uniform Binomial
Round answers to four decimal places.
b. What proportion of the samples will have a mean useful life of more than 38.5
hours?
Probability
What is the probability that a randomly selected AA battery will have a useful
life of at most 36.5 hours?
с.
Probability
d.
What proportion of the samples will have a mean useful life between 36.5 and
38.5 hours?
Probability
Expert Solution
This question has been solved!
Explore an expertly crafted, step-by-step solution for a thorough understanding of key concepts.

This is a popular solution!

Trending now
This is a popular solution!

Step by step
Solved in 2 steps with 2 images

Recommended textbooks for you
Glencoe Algebra 1, Student Edition, 9780079039897…
Algebra
ISBN:
9780079039897
Author:
Carter
Publisher:
McGraw Hill
Glencoe Algebra 1, Student Edition, 9780079039897…
Algebra
ISBN:
9780079039897
Author:
Carter
Publisher:
McGraw Hill