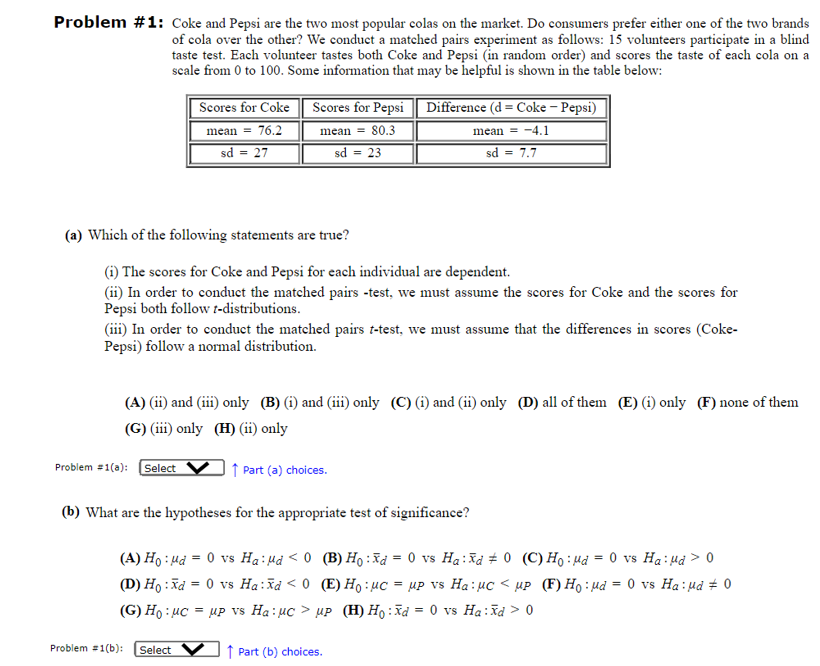
Problem #1: Coke and Pepsi are the two most popular colas on the market. Do consumers prefer either one of the two brands of cola over the other? We conduct a matched pairs experiment as follows: 15 volunteers participate in a blind taste test. Each volunteer tastes both Coke and Pepsi (in random order) and scores the taste of each cola on a scale from 0 to 100. Some information that may be helpful is shown in the table below: Scores for Coke mean = 76.2 sd = 27 Scores for Pepsi Difference (d = Coke - Pepsi) mean = 80.3 mean -4.1 sd = 23 sd = 7.7 (a) Which of the following statements are true? (i) The scores for Coke and Pepsi for each individual are dependent. (ii) In order to conduct the matched pairs -test, we must assume the scores for Coke and the scores for Pepsi both follow t-distributions. (iii) In order to conduct the matched pairs t-test, we must assume that the differences in scores (Coke- Pepsi) follow a normal distribution. (A) (ii) and (iii) only (B) (i) and (iii) only (C) (i) and (ii) only (D) all of them (E) (i) only (F) none of them (G) (iii) only (H) (ii) only Problem #1(a): Select ↑ Part (a) choices. (b) What are the hypotheses for the appropriate test of significance? (A) Ho Hd = 0 vs Haμd <0 (B) Hod = 0 vs Had 0 (C) Hoμd = 0 vs Ha:µd > 0 (D) Ho: xd = 0 vs Ha: xd <0 (E) Hoμc = μp vs Нa: μc up (H) Ho: Xd=0 vs Ha: xd > 0 Problem #1(b): Select ↑ Part (b) choices.
Problem #1: Coke and Pepsi are the two most popular colas on the market. Do consumers prefer either one of the two brands of cola over the other? We conduct a matched pairs experiment as follows: 15 volunteers participate in a blind taste test. Each volunteer tastes both Coke and Pepsi (in random order) and scores the taste of each cola on a scale from 0 to 100. Some information that may be helpful is shown in the table below: Scores for Coke mean = 76.2 sd = 27 Scores for Pepsi Difference (d = Coke - Pepsi) mean = 80.3 mean -4.1 sd = 23 sd = 7.7 (a) Which of the following statements are true? (i) The scores for Coke and Pepsi for each individual are dependent. (ii) In order to conduct the matched pairs -test, we must assume the scores for Coke and the scores for Pepsi both follow t-distributions. (iii) In order to conduct the matched pairs t-test, we must assume that the differences in scores (Coke- Pepsi) follow a normal distribution. (A) (ii) and (iii) only (B) (i) and (iii) only (C) (i) and (ii) only (D) all of them (E) (i) only (F) none of them (G) (iii) only (H) (ii) only Problem #1(a): Select ↑ Part (a) choices. (b) What are the hypotheses for the appropriate test of significance? (A) Ho Hd = 0 vs Haμd <0 (B) Hod = 0 vs Had 0 (C) Hoμd = 0 vs Ha:µd > 0 (D) Ho: xd = 0 vs Ha: xd <0 (E) Hoμc = μp vs Нa: μc up (H) Ho: Xd=0 vs Ha: xd > 0 Problem #1(b): Select ↑ Part (b) choices.

MATLAB: An Introduction with Applications
6th Edition
ISBN:9781119256830
Author:Amos Gilat
Publisher:Amos Gilat
Chapter1: Starting With Matlab
Section: Chapter Questions
Problem 1P

Related questions
Question
100%
Please show a step-by-step solution. Please do not skip steps.
Transcribed Image Text:Problem #1: Coke and Pepsi are the two most popular colas on the market. Do consumers prefer either one of the two brands
of cola over the other? We conduct a matched pairs experiment as follows: 15 volunteers participate in a blind
taste test. Each volunteer tastes both Coke and Pepsi (in random order) and scores the taste of each cola on a
scale from 0 to 100. Some information that may be helpful is shown in the table below:
Scores for Coke Scores for Pepsi Difference (d = Coke - Pepsi)
mean = 76.2
sd = 27
mean = 80.3
sd
=23
sd
mean -4.1
= 7.7
(a) Which of the following statements are true?
(i) The scores for Coke and Pepsi for each individual are dependent.
(ii) In order to conduct the matched pairs -test, we must assume the scores for Coke and the scores for
Pepsi both follow t-distributions.
(iii) In order to conduct the matched pairs t-test, we must assume that the differences in scores (Coke-
Pepsi) follow a normal distribution.
(A) (ii) and (iii) only (B) (i) and (iii) only (C) (i) and (ii) only (D) all of them (E) (i) only (F) none of them
(G) (iii) only (H) (ii) only
Problem #1(a): Select
↑ Part (a) choices.
(b) What are the hypotheses for the appropriate test of significance?
(A) Ho Hd 0 vs Ha: "d<0
(D) Hoxd 0 vs Ha: xd <0
(G) Ho: μC = up vs Ha:UC >
Problem #1(b): Select
↑ Part (b) choices.
(B) Ho: xd = 0 vs Ha: xd 0 (C) Hoμd = 0 vs Haμd > 0
(E) Ho μC =μP vs Ha: μC<μP (F) Ho: μd = 0 vs Haμd 0
up (H) Ho:Xd = 0 vs Ha:Xd >0
Expert Solution
This question has been solved!
Explore an expertly crafted, step-by-step solution for a thorough understanding of key concepts.

Step by step
Solved in 4 steps with 5 images

Follow-up Questions
Read through expert solutions to related follow-up questions below.
Follow-up Question
Please answer these questions using the following answers. Please do not skip steps.

Transcribed Image Text:Problem #1: Coke and Pepsi are the two most popular colas on the market. Do consumers prefer either one of the two brands
of cola over the other? We conduct a matched pairs experiment as follows: 15 volunteers participate in a blind
taste test. Each volunteer tastes both Coke and Pepsi (in random order) and scores the taste of each cola on a
scale from 0 to 100. Some information that may be helpful is shown in the table below:
Scores for Coke
mean -76.2
sd=27
Scores for Pepsi
mean
80.3
sd-23
Difference (d=Coke - Pepsi)
mean --4.1
sd = 7.7
(c) Assuming the appropriate assumptions are satisfied, what is the value of the test statistic for the appropriate
test of significance?
Problem #1(c):
answer correct to 2 decimals
(d) which is the correct interpretation of the p-value for the test in (b) and (c)?
(A) If the mean difference in the scores of Coke and Pepsi is 0, the probability of observing an average difference of
scores (defined as Coke-Pepsi) of -4.1 or more extreme (in either direction) is 0.0291.
(B) If the mean difference in the scores of Coke and Pepsi is not 0, the probability of observing an average
difference of scores (defined as Coke-Pepsi) of -4.1 or more extreme (in either direction) is 0.0583.
(C) If the scores of Coke are higher than the scores of Pepsi on average, then the probability of observing a mean
difference of -4.1 or less is 0.0583.
(D) If the scores of Coke are higher than the scores of Pepsi on average, then the probability of observing a mean
difference of -4.1 or less is 0.0291.
(E) If the scores of Pepsi are higher than the scores of Coke, on average, then the probability of observing a mean
difference of 4.1 or more is 0.0583.
(F) If the mean difference in the scores of Coke and Pepsi is not 0, the probability of observing an average
difference of scores (defined as Coke-Pepsi) of -4.1 or more extreme (in either direction) is 0.0291.
(G) If the mean difference in the scores of Coke and Pepsi is 0, the probability of observing an average difference of
scores (defined as Coke-Pepsi) of -4.1 or more extreme (in either direction) is 0.0583.
(H) If the scores of Pepsi are higher than the scores of Coke, on average, then the probability of observing a mean
difference of 4.1 or more is 0.0291.
Problem #1: Select Part (8) choices.
Solution
Recommended textbooks for you
MATLAB: An Introduction with Applications
Statistics
ISBN:
9781119256830
Author:
Amos Gilat
Publisher:
John Wiley & Sons Inc

Probability and Statistics for Engineering and th…
Statistics
ISBN:
9781305251809
Author:
Jay L. Devore
Publisher:
Cengage Learning

Statistics for The Behavioral Sciences (MindTap C…
Statistics
ISBN:
9781305504912
Author:
Frederick J Gravetter, Larry B. Wallnau
Publisher:
Cengage Learning
MATLAB: An Introduction with Applications
Statistics
ISBN:
9781119256830
Author:
Amos Gilat
Publisher:
John Wiley & Sons Inc
Probability and Statistics for Engineering and th…
Statistics
ISBN:
9781305251809
Author:
Jay L. Devore
Publisher:
Cengage Learning
Statistics for The Behavioral Sciences (MindTap C…
Statistics
ISBN:
9781305504912
Author:
Frederick J Gravetter, Larry B. Wallnau
Publisher:
Cengage Learning

Elementary Statistics: Picturing the World (7th E…
Statistics
ISBN:
9780134683416
Author:
Ron Larson, Betsy Farber
Publisher:
PEARSON

The Basic Practice of Statistics
Statistics
ISBN:
9781319042578
Author:
David S. Moore, William I. Notz, Michael A. Fligner
Publisher:
W. H. Freeman

Introduction to the Practice of Statistics
Statistics
ISBN:
9781319013387
Author:
David S. Moore, George P. McCabe, Bruce A. Craig
Publisher:
W. H. Freeman