Problem 1 In probability theory, a random variable X is a function from sample space of a random experiment (the set of all possible outcomesi to the real numbers. For instonce, if we were to choose a person ot random, we might let X= height of selected person. We might ask What is the probability that the selected person is between 18 and 19 meters tal? with the symbols P(18
Problem 1 In probability theory, a random variable X is a function from sample space of a random experiment (the set of all possible outcomesi to the real numbers. For instonce, if we were to choose a person ot random, we might let X= height of selected person. We might ask What is the probability that the selected person is between 18 and 19 meters tal? with the symbols P(18

MATLAB: An Introduction with Applications
6th Edition
ISBN:9781119256830
Author:Amos Gilat
Publisher:Amos Gilat
Chapter1: Starting With Matlab
Section: Chapter Questions
Problem 1P

Related questions

Question
Sorry Accidentally uploaded wrong image for problem 1
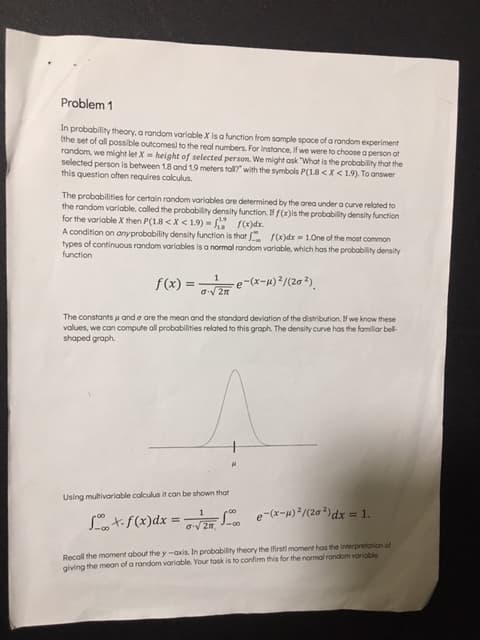
Transcribed Image Text:Problem 1
In probability theory, a random variable X is a function from sample space of a random experiment
(the set of all possible outcomesi to the real numbers. For instonce, if we were to choose a person ot
random, we might let X= height of selected person. We might ask What is the probability that the
selected person is between 18 and 19 meters tal? with the symbols P(18<X<19). To answer
this question often requires calculus
The probabilities for certain random variables ore determined by the area under a curve related to
the random variable, colled the probability density function. Iff(x)is the probability density function
for the variable X then P(18 <X <1.9) - rdr.
A condition on anyprobability density function is that f(x)dx = 1.0ne of the most common
types of continuous random variables is a normal random variable, which has the probability density
function
f(x) =
-e-(x-w)²/(2a ²),
The constants u and a are the mean and the standard deviation of the distribution. If we know these
values, we can compute all probabilities related to this graph. The density curve has the familiar bel-
shaped graph.
Using multivariable colculus it can be shown that
e-(x-H)*/(20 ²)dx = 1.
Lo t-f(x)dx =
Recall the moment about the y -axis. In probability theory the first) moment has the interpretation of
giving the mean of a random variable. Your tosk is to confirm this for the normal random variable
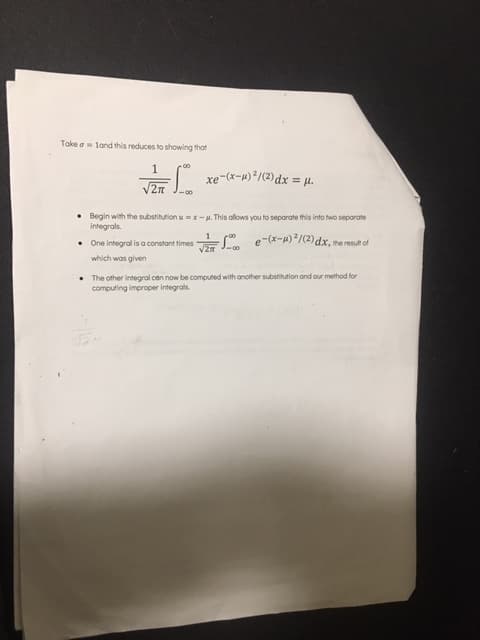
Transcribed Image Text:Take a- land this reduces to showing that
xe-(x-w)³/(2)dx = µ.
V2n
Begin with the substitution u =x-u. This allows you to seporate this into two separate
integrals.
• One integral is a constant times
V2
which was given
• The other Integral can now be computed with another substitution and our method for
computing improper integrals.
Expert Solution
This question has been solved!
Explore an expertly crafted, step-by-step solution for a thorough understanding of key concepts.

This is a popular solution!

Trending now
This is a popular solution!

Step by step
Solved in 3 steps with 6 images

Knowledge Booster


Learn more about
Need a deep-dive on the concept behind this application? Look no further. Learn more about this topic, statistics and related others by exploring similar questions and additional content below.Recommended textbooks for you
MATLAB: An Introduction with Applications
Statistics
ISBN:
9781119256830
Author:
Amos Gilat
Publisher:
John Wiley & Sons Inc

Probability and Statistics for Engineering and th…
Statistics
ISBN:
9781305251809
Author:
Jay L. Devore
Publisher:
Cengage Learning

Statistics for The Behavioral Sciences (MindTap C…
Statistics
ISBN:
9781305504912
Author:
Frederick J Gravetter, Larry B. Wallnau
Publisher:
Cengage Learning
MATLAB: An Introduction with Applications
Statistics
ISBN:
9781119256830
Author:
Amos Gilat
Publisher:
John Wiley & Sons Inc
Probability and Statistics for Engineering and th…
Statistics
ISBN:
9781305251809
Author:
Jay L. Devore
Publisher:
Cengage Learning
Statistics for The Behavioral Sciences (MindTap C…
Statistics
ISBN:
9781305504912
Author:
Frederick J Gravetter, Larry B. Wallnau
Publisher:
Cengage Learning

Elementary Statistics: Picturing the World (7th E…
Statistics
ISBN:
9780134683416
Author:
Ron Larson, Betsy Farber
Publisher:
PEARSON

The Basic Practice of Statistics
Statistics
ISBN:
9781319042578
Author:
David S. Moore, William I. Notz, Michael A. Fligner
Publisher:
W. H. Freeman

Introduction to the Practice of Statistics
Statistics
ISBN:
9781319013387
Author:
David S. Moore, George P. McCabe, Bruce A. Craig
Publisher:
W. H. Freeman