Problem 1: The demand and price of onions per kg is given in the following table: Price (Tk.) 25 37 40 45 48 50 55 70 + X Demand (kg) 10 8 9. 7.5 5 4.5 3 (Where X is the last digit of your ID +1. Take the result of VX rounded to 1 digit after decimal point) a) Find the relationship between demand and price using a scatter diagram and comment (interpret). b) Find the correlation coefficient and comment (interpret). INIVERSITY
Problem 1: The demand and price of onions per kg is given in the following table: Price (Tk.) 25 37 40 45 48 50 55 70 + X Demand (kg) 10 8 9. 7.5 5 4.5 3 (Where X is the last digit of your ID +1. Take the result of VX rounded to 1 digit after decimal point) a) Find the relationship between demand and price using a scatter diagram and comment (interpret). b) Find the correlation coefficient and comment (interpret). INIVERSITY

Algebra & Trigonometry with Analytic Geometry
13th Edition
ISBN:9781133382119
Author:Swokowski
Publisher:Swokowski
Chapter7: Analytic Trigonometry
Section7.6: The Inverse Trigonometric Functions
Problem 91E

Related questions
Question
ID = 21304077
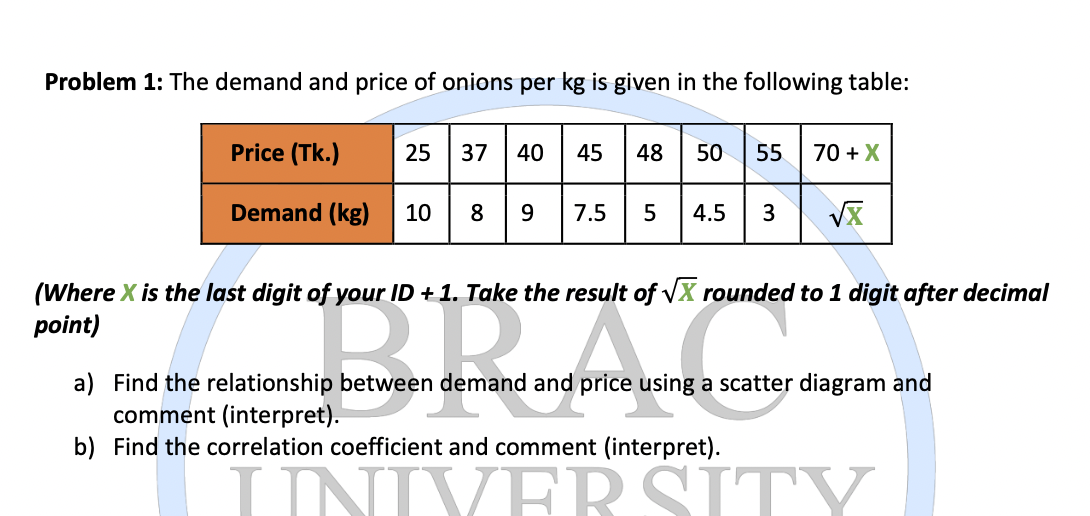
Transcribed Image Text:Problem 1: The demand and price of onions per kg is given in the following table:
Price (Tk.)
25
37
40
45
48
50
55
70 + X
Demand (kg)
10
8.
7.5
4.5
(Where X is the last digit of your ID +1. Take the result of VX rounded to 1 digit after decimal
point)
a) Find the relationship between demand and price using a scatter diagram and
comment (interpret).
b) Find the correlation coefficient and comment (interpret).
INIVER SÍTY
Expert Solution
This question has been solved!
Explore an expertly crafted, step-by-step solution for a thorough understanding of key concepts.

This is a popular solution!

Trending now
This is a popular solution!

Step by step
Solved in 3 steps with 4 images

Recommended textbooks for you
Algebra & Trigonometry with Analytic Geometry
Algebra
ISBN:
9781133382119
Author:
Swokowski
Publisher:
Cengage
Algebra & Trigonometry with Analytic Geometry
Algebra
ISBN:
9781133382119
Author:
Swokowski
Publisher:
Cengage