Problem 1 The table below shows the data about the years of working experience and the income of ten employees in a big industrial corporation. Required: a) Draw the scatter diagram and draw the trend line. b) Find the equation of the least squares regression line. c) Predict the income when x = 16 years. Income Years of Working Experience Employees (Thousand of Pesos) 10 12 15 20 B 10 13 C 18 19 15 E F 18 20 23 25 25 30 32 H J 30 21
Problem 1 The table below shows the data about the years of working experience and the income of ten employees in a big industrial corporation. Required: a) Draw the scatter diagram and draw the trend line. b) Find the equation of the least squares regression line. c) Predict the income when x = 16 years. Income Years of Working Experience Employees (Thousand of Pesos) 10 12 15 20 B 10 13 C 18 19 15 E F 18 20 23 25 25 30 32 H J 30 21

Engineering Fundamentals: An Introduction to Engineering (MindTap Course List)
5th Edition
ISBN:9781305084766
Author:Saeed Moaveni
Publisher:Saeed Moaveni
Chapter20: Engineering Economics
Section: Chapter Questions
Problem 46P

Related questions

Concept explainers
Question
Need answer!
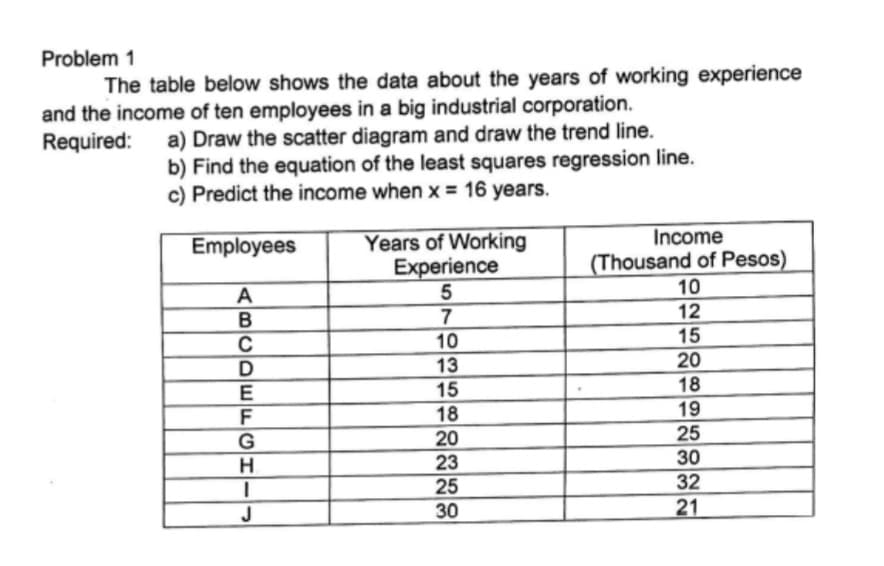
Transcribed Image Text:Problem 1
The table below shows the data about the years of working experience
and the income of ten employees in a big industrial corporation.
Required:
a) Draw the scatter diagram and draw the trend line.
b) Find the equation of the least squares regression line.
c) Predict the income when x = 16 years.
Years of Working
Experience
Income
(Thousand of Pesos)
10
Employees
7
12
15
10
13
15
20
18
E
19
25
18
20
23
25
30
H.
32
J
30
21
Expert Solution
This question has been solved!
Explore an expertly crafted, step-by-step solution for a thorough understanding of key concepts.

Step by step
Solved in 4 steps with 2 images

Knowledge Booster


Learn more about
Need a deep-dive on the concept behind this application? Look no further. Learn more about this topic, civil-engineering and related others by exploring similar questions and additional content below.Recommended textbooks for you
Engineering Fundamentals: An Introduction to Engi…
Civil Engineering
ISBN:
9781305084766
Author:
Saeed Moaveni
Publisher:
Cengage Learning
Engineering Fundamentals: An Introduction to Engi…
Civil Engineering
ISBN:
9781305084766
Author:
Saeed Moaveni
Publisher:
Cengage Learning