Problem 10.4. We continue with the situation in Problem 8.8. Assume 19 and n2 12 and the two sample that the two sample sizes are ni variances are s? = 0.81 and s = 0.49. Is there enough evidence that fam- ilies from culled populations have a lower bunching intensity than families from non-culled populations? Use a test of hypothesis at level a = Suppose that the two populations are normally distributed with equal vari- 0.005. ances.
Problem 10.4. We continue with the situation in Problem 8.8. Assume 19 and n2 12 and the two sample that the two sample sizes are ni variances are s? = 0.81 and s = 0.49. Is there enough evidence that fam- ilies from culled populations have a lower bunching intensity than families from non-culled populations? Use a test of hypothesis at level a = Suppose that the two populations are normally distributed with equal vari- 0.005. ances.

MATLAB: An Introduction with Applications
6th Edition
ISBN:9781119256830
Author:Amos Gilat
Publisher:Amos Gilat
Chapter1: Starting With Matlab
Section: Chapter Questions
Problem 1P

Related questions
Topic Video
Question
100%
I only need 10.4, 8.8 is for refrence. I looked up online and there is 2 answers online and idk which one is right, one answer is they do s1/s2 and get f then get p=0.993 so no eveidence. The other answer is u get t= -4.24 and p=0.00012 and so there is enough evidence. Plz dont make a guess and try to give the right answer
![Problem 8.8. Between 1967 and 1995, South Africa controlled its elephant
populations through “culling", i.e. killing older animals. Scientists believe
that in some populations, the surviving young elephants who experienced
culling have symptoms similar to the post-traumatic stress disorder in hu-
mans. The authors of article [60] investigated the effects of culling, using
a variable called "bunching intensity", which gives the response to threat
for a family of adult female elephants. This variable has values between 0
and 4, with 0 =
"no response" and 4 = "very fast response". We consider
two populations of elephants, one of which had experienced culling and the
other had not. A sample of n1 families from the culled population has a
mean bunching intensity of 1.2, whereas a sample of n2 families from the
non-culled population has a mean bunching intensity of 2.5. The mean
bunching intensity for the combined two samples is 1.7. What is the pro-
portion of families who experienced culling in the combined two samples?](/v2/_next/image?url=https%3A%2F%2Fcontent.bartleby.com%2Fqna-images%2Fquestion%2F7a332b0b-ce98-466d-bd1a-16f22914526d%2F7f291f44-09b9-4942-bf52-608041cd56cb%2Flb02syo_processed.png&w=3840&q=75)
Transcribed Image Text:Problem 8.8. Between 1967 and 1995, South Africa controlled its elephant
populations through “culling", i.e. killing older animals. Scientists believe
that in some populations, the surviving young elephants who experienced
culling have symptoms similar to the post-traumatic stress disorder in hu-
mans. The authors of article [60] investigated the effects of culling, using
a variable called "bunching intensity", which gives the response to threat
for a family of adult female elephants. This variable has values between 0
and 4, with 0 =
"no response" and 4 = "very fast response". We consider
two populations of elephants, one of which had experienced culling and the
other had not. A sample of n1 families from the culled population has a
mean bunching intensity of 1.2, whereas a sample of n2 families from the
non-culled population has a mean bunching intensity of 2.5. The mean
bunching intensity for the combined two samples is 1.7. What is the pro-
portion of families who experienced culling in the combined two samples?
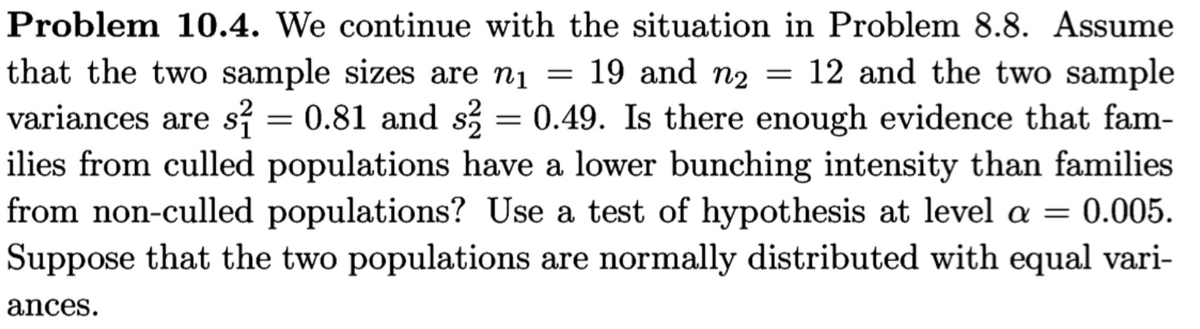
Transcribed Image Text:Problem 10.4. We continue with the situation in Problem 8.8. Assume
that the two sample sizes are nį = 19 and n2 = 12 and the two sample
variances are s = 0.81 and s = 0.49. Is there enough evidence that fam-
ilies from culled populations have a lower bunching intensity than families
from non-culled populations? Use a test of hypothesis at level a = 0.005.
Suppose that the two populations are normally distributed with equal vari-
%3D
ances.
Expert Solution
This question has been solved!
Explore an expertly crafted, step-by-step solution for a thorough understanding of key concepts.

Step by step
Solved in 2 steps with 2 images

Knowledge Booster


Learn more about
Need a deep-dive on the concept behind this application? Look no further. Learn more about this topic, statistics and related others by exploring similar questions and additional content below.Recommended textbooks for you
MATLAB: An Introduction with Applications
Statistics
ISBN:
9781119256830
Author:
Amos Gilat
Publisher:
John Wiley & Sons Inc

Probability and Statistics for Engineering and th…
Statistics
ISBN:
9781305251809
Author:
Jay L. Devore
Publisher:
Cengage Learning

Statistics for The Behavioral Sciences (MindTap C…
Statistics
ISBN:
9781305504912
Author:
Frederick J Gravetter, Larry B. Wallnau
Publisher:
Cengage Learning
MATLAB: An Introduction with Applications
Statistics
ISBN:
9781119256830
Author:
Amos Gilat
Publisher:
John Wiley & Sons Inc
Probability and Statistics for Engineering and th…
Statistics
ISBN:
9781305251809
Author:
Jay L. Devore
Publisher:
Cengage Learning
Statistics for The Behavioral Sciences (MindTap C…
Statistics
ISBN:
9781305504912
Author:
Frederick J Gravetter, Larry B. Wallnau
Publisher:
Cengage Learning

Elementary Statistics: Picturing the World (7th E…
Statistics
ISBN:
9780134683416
Author:
Ron Larson, Betsy Farber
Publisher:
PEARSON

The Basic Practice of Statistics
Statistics
ISBN:
9781319042578
Author:
David S. Moore, William I. Notz, Michael A. Fligner
Publisher:
W. H. Freeman

Introduction to the Practice of Statistics
Statistics
ISBN:
9781319013387
Author:
David S. Moore, George P. McCabe, Bruce A. Craig
Publisher:
W. H. Freeman