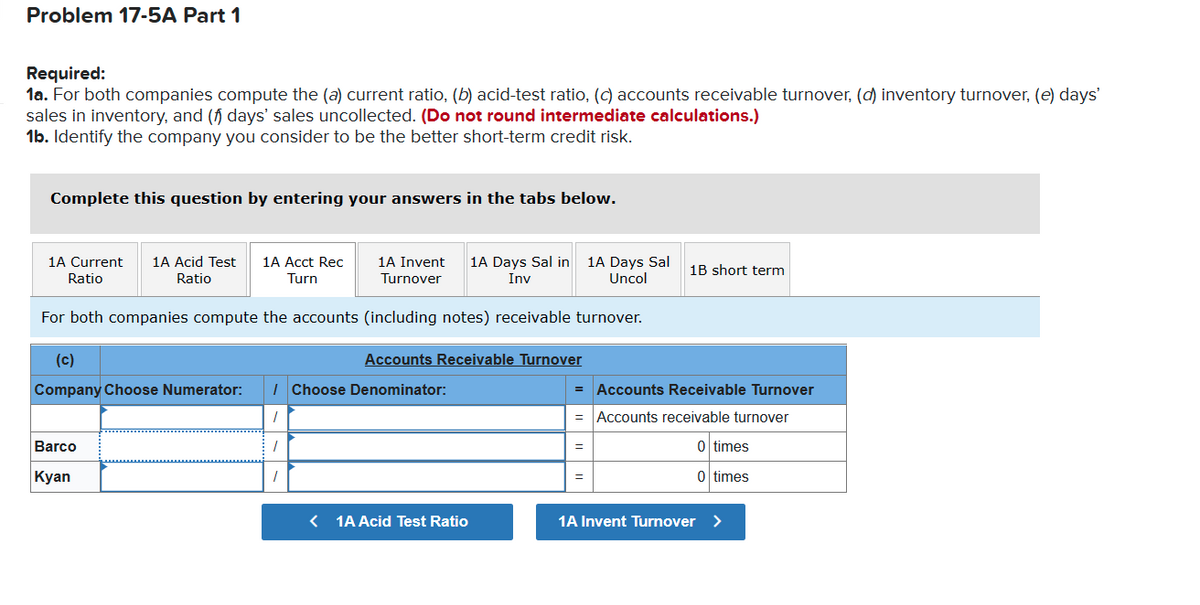
Problem 17-5A Comparative ratio analysis LO P3 Skip to question [The following information applies to the questions displayed below.] Summary information from the financial statements of two companies competing in the same industry follows. Barco Company Kyan Company Barco Company Kyan Company Data from the current year-end balance sheets Data from the current year’s income statement Assets Sales $ 770,000 $ 882,200 Cash $ 19,000 $ 37,000 Cost of goods sold 593,100 638,500 Accounts receivable, net 36,400 58,400 Interest expense 7,800 18,000 Merchandise inventory 84,440 130,500 Income tax expense 14,800 24,355 Prepaid expenses 5,500 7,150 Net income 154,300 201,345 Plant assets, net 370,000 312,400 Basic earnings per share 4.06 4.09 Total assets $ 515,340 $ 545,450 Cash dividends per share 3.78 3.94 Liabilities and Equity Beginning-of-year balance sheet data Current liabilities $ 67,340 $ 95,300 Accounts receivable, net $ 26,800 $ 56,200 Long-term notes payable 79,800 103,000 Merchandise inventory 61,600 111,400 Common stock, $5 par value 190,000 246,000 Total assets 438,000 392,500 Retained earnings 178,200 101,150 Common stock, $5 par value 190,000 246,000 Total liabilities and equity $ 515,340 $ 545,450 Retained earnings 167,540 93,653 I need help filling out the tabs thnak you once again


Reporting Cash Flows
Reporting of cash flows means a statement of cash flow which is a financial statement. A cash flow statement is prepared by gathering all the data regarding inflows and outflows of a company. The cash flow statement includes cash inflows and outflows from various activities such as operating, financing, and investment. Reporting this statement is important because it is the main financial statement of the company.
Balance Sheet
A balance sheet is an integral part of the set of financial statements of an organization that reports the assets, liabilities, equity (shareholding) capital, other short and long-term debts, along with other related items. A balance sheet is one of the most critical measures of the financial performance and position of the company, and as the name suggests, the statement must balance the assets against the liabilities and equity. The assets are what the company owns, and the liabilities represent what the company owes. Equity represents the amount invested in the business, either by the promoters of the company or by external shareholders. The total assets must match total liabilities plus equity.
Financial Statements
Financial statements are written records of an organization which provide a true and real picture of business activities. It shows the financial position and the operating performance of the company. It is prepared at the end of every financial cycle. It includes three main components that are balance sheet, income statement and cash flow statement.
Owner's Capital
Before we begin to understand what Owner’s capital is and what Equity financing is to an organization, it is important to understand some basic accounting terminologies. A double-entry bookkeeping system Normal account balances are those which are expected to have either a debit balance or a credit balance, depending on the nature of the account. An asset account will have a debit balance as normal balance because an asset is a debit account. Similarly, a liability account will have the normal balance as a credit balance because it is amount owed, representing a credit account. Equity is also said to have a credit balance as its normal balance. However, sometimes the normal balances may be reversed, often due to incorrect journal or posting entries or other accounting/ clerical errors.
Problem 17-5A Comparative ratio analysis LO P3
Skip to question
[The following information applies to the questions displayed below.]
Summary information from the financial statements of two companies competing in the same industry follows.
| Barco Company |
Kyan Company |
Barco Company |
Kyan Company |
|||||||||||
| Data from the current year-end balance sheets | Data from the current year’s income statement | |||||||||||||
| Assets | Sales | $ | 770,000 | $ | 882,200 | |||||||||
| Cash | $ | 19,000 | $ | 37,000 | Cost of goods sold | 593,100 | 638,500 | |||||||
| 36,400 | 58,400 | Interest expense | 7,800 | 18,000 | ||||||||||
| Merchandise inventory | 84,440 | 130,500 | Income tax expense | 14,800 | 24,355 | |||||||||
| Prepaid expenses | 5,500 | 7,150 | Net income | 154,300 | 201,345 | |||||||||
| Plant assets, net | 370,000 | 312,400 | Basic earnings per share | 4.06 | 4.09 | |||||||||
| Total assets | $ | 515,340 | $ | 545,450 | Cash dividends per share | 3.78 | 3.94 | |||||||
| Liabilities and Equity | Beginning-of-year balance sheet data | |||||||||||||
| Current liabilities | $ | 67,340 | $ | 95,300 | Accounts receivable, net | $ | 26,800 | $ | 56,200 | |||||
| Long-term notes payable | 79,800 | 103,000 | Merchandise inventory | 61,600 | 111,400 | |||||||||
| Common stock, $5 par value | 190,000 | 246,000 | Total assets | 438,000 | 392,500 | |||||||||
| 178,200 | 101,150 | Common stock, $5 par value | 190,000 | 246,000 | ||||||||||
| Total liabilities and equity | $ | 515,340 | $ | 545,450 | Retained earnings | 167,540 | 93,653 | |||||||
I need help filling out the tabs thnak you once again.
![Problem 17-5A Comparative ratio analysis LO P3
[The following information applies to the questions displayed below.]
Summary information from the financial statements of two companies competing in the same industry follows.
Barco
Кyan
Company
Barco
Кyan
Company
Company
Compar
Data from the current year-end balance sheets
Data from the current year's income statement
Sales
$770,000 $882, 20
593,100
7,800
14,800
154, 300
Assets
$ 19,000 $ 37,000
58,400
130,500
7,150
312,400
638,50
Cost of goods sold
Interest expense
Cash
Accounts receivable, net
Merchandise inventory
Prepaid expenses
36,400
84,440
5,500
370,000
18,0=
Income tax expense
24,35
Net income
201,34
Plant assets, net
Basic earnings per share
4.06
4.
Total assets
$515,340 $545,450
Cash dividends per share
3.78
3.5
Liabilities and Equity
$ 67,340 $ 95,300
103,000
246,000
101,150
Beginning-of-year balance sheet data
Accounts receivable, net
Merchandise inventory
Total assets
$ 26,800 $ 56,20
111,40
61,600
392,50
438,000
Current liabilities
Long-term notes payable
Common stock, $5 par value
Retained earnings
79,800
190,000
178, 200
Common stock, $5 par value
190, 000
246,00
Total liabilities and equity
$515,340 $545,450
Retained earnings
167,540
93,6
oblem 17-5A Part 1](/v2/_next/image?url=https%3A%2F%2Fcontent.bartleby.com%2Fqna-images%2Fquestion%2F34b06b3a-cf06-42fd-a4ac-3963b5656154%2Fa673b598-5383-463d-920c-1fc5fe2c424c%2Fgm9cyr_processed.png&w=3840&q=75)


Trending now
This is a popular solution!

Step by step
Solved in 4 steps


