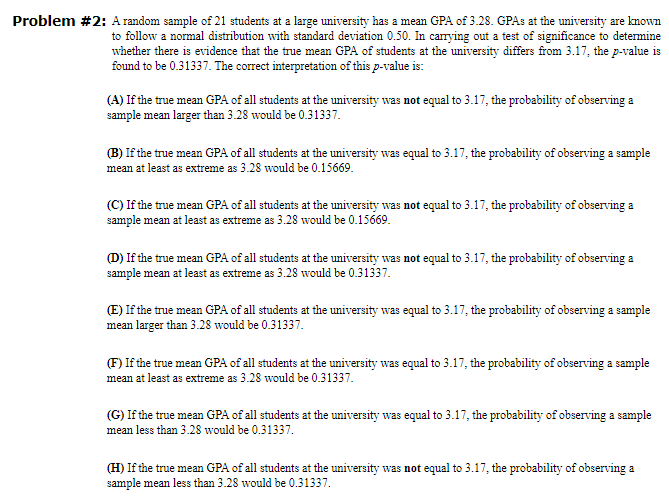
Problem #2: A random sample of 21 students at a large university has a mean GPA of 3.28. GPAs at the university are known to follow a normal distribution with standard deviation 0.50. In carrying out a test of significance to determine whether there is evidence that the true mean GPA of students at the university differs from 3.17, the p-value is found to be 0.31337. The correct interpretation of this p-value is: (A) If the true mean GPA of all students at the university was not equal to 3.17, the probability of observing a sample mean larger than 3.28 would be 0.31337. (B) If the true mean GPA of all students at the university was equal to 3.17, the probability of observing a sample mean at least as extreme as 3.28 would be 0.15669. (C) If the true mean GPA of all students at the university was not equal to 3.17, the probability of observing a sample mean at least as extreme as 3.28 would be 0.15669. (D) If the true mean GPA of all students at the university was not equal to 3.17, the probability of observing a sample mean at least as extreme as 3.28 would be 0.31337. (E) If the true mean GPA of all students at the university was equal to 3.17, the probability of observing a sample mean larger than 3.28 would be 0.31337. (F) If the true mean GPA of all students at the university was equal to 3.17, the probability of observing a sample mean at least as extreme as 3.28 would be 0.31337. (G) If the true mean GPA of all students at the university was equal to 3.17, the probability of observing a sample mean less than 3.28 would be 0.31337. (H) If the true mean GPA of all students at the university was not equal to 3.17, the probability of observing a sample mean less than 3.28 would be 0.31337.
Problem #2: A random sample of 21 students at a large university has a mean GPA of 3.28. GPAs at the university are known to follow a normal distribution with standard deviation 0.50. In carrying out a test of significance to determine whether there is evidence that the true mean GPA of students at the university differs from 3.17, the p-value is found to be 0.31337. The correct interpretation of this p-value is: (A) If the true mean GPA of all students at the university was not equal to 3.17, the probability of observing a sample mean larger than 3.28 would be 0.31337. (B) If the true mean GPA of all students at the university was equal to 3.17, the probability of observing a sample mean at least as extreme as 3.28 would be 0.15669. (C) If the true mean GPA of all students at the university was not equal to 3.17, the probability of observing a sample mean at least as extreme as 3.28 would be 0.15669. (D) If the true mean GPA of all students at the university was not equal to 3.17, the probability of observing a sample mean at least as extreme as 3.28 would be 0.31337. (E) If the true mean GPA of all students at the university was equal to 3.17, the probability of observing a sample mean larger than 3.28 would be 0.31337. (F) If the true mean GPA of all students at the university was equal to 3.17, the probability of observing a sample mean at least as extreme as 3.28 would be 0.31337. (G) If the true mean GPA of all students at the university was equal to 3.17, the probability of observing a sample mean less than 3.28 would be 0.31337. (H) If the true mean GPA of all students at the university was not equal to 3.17, the probability of observing a sample mean less than 3.28 would be 0.31337.

MATLAB: An Introduction with Applications
6th Edition
ISBN:9781119256830
Author:Amos Gilat
Publisher:Amos Gilat
Chapter1: Starting With Matlab
Section: Chapter Questions
Problem 1P

Related questions
Question
can you please show the step by step solution. please do not skip steps. explain why you got the answer you did.
Transcribed Image Text:Problem #2: A random sample of 21 students at a large university has a mean GPA of 3.28. GPAs at the university are known
to follow a normal distribution with standard deviation 0.50. In carrying out a test of significance to determine
whether there is evidence that the true mean GPA of students at the university differs from 3.17, the p-value is
found to be 0.31337. The correct interpretation of this p-value is:
(A) If the true mean GPA of all students at the university was not equal to 3.17, the probability of observing a
sample mean larger than 3.28 would be 0.31337.
(B) If the true mean GPA of all students at the university was equal to 3.17, the probability of observing a sample
mean at least as extreme as 3.28 would be 0.15669.
(C) If the true mean GPA of all students at the university was not equal to 3.17, the probability of observing a
sample mean at least as extreme as 3.28 would be 0.15669.
(D) If the true mean GPA of all students at the university was not equal to 3.17, the probability of observing a
sample mean at least as extreme as 3.28 would be 0.31337.
(E) If the true mean GPA of all students at the university was equal to 3.17, the probability of observing a sample
mean larger than 3.28 would be 0.31337.
(F) If the true mean GPA of all students at the university was equal to 3.17, the probability of observing a sample
mean at least as extreme as 3.28 would be 0.31337.
(G) If the true mean GPA of all students at the university was equal to 3.17, the probability of observing a sample
mean less than 3.28 would be 0.31337.
(H) If the true mean GPA of all students at the university was not equal to 3.17, the probability of observing a
sample mean less than 3.28 would be 0.31337.
Expert Solution
This question has been solved!
Explore an expertly crafted, step-by-step solution for a thorough understanding of key concepts.

Step by step
Solved in 3 steps with 3 images

Recommended textbooks for you
MATLAB: An Introduction with Applications
Statistics
ISBN:
9781119256830
Author:
Amos Gilat
Publisher:
John Wiley & Sons Inc

Probability and Statistics for Engineering and th…
Statistics
ISBN:
9781305251809
Author:
Jay L. Devore
Publisher:
Cengage Learning

Statistics for The Behavioral Sciences (MindTap C…
Statistics
ISBN:
9781305504912
Author:
Frederick J Gravetter, Larry B. Wallnau
Publisher:
Cengage Learning
MATLAB: An Introduction with Applications
Statistics
ISBN:
9781119256830
Author:
Amos Gilat
Publisher:
John Wiley & Sons Inc
Probability and Statistics for Engineering and th…
Statistics
ISBN:
9781305251809
Author:
Jay L. Devore
Publisher:
Cengage Learning
Statistics for The Behavioral Sciences (MindTap C…
Statistics
ISBN:
9781305504912
Author:
Frederick J Gravetter, Larry B. Wallnau
Publisher:
Cengage Learning

Elementary Statistics: Picturing the World (7th E…
Statistics
ISBN:
9780134683416
Author:
Ron Larson, Betsy Farber
Publisher:
PEARSON

The Basic Practice of Statistics
Statistics
ISBN:
9781319042578
Author:
David S. Moore, William I. Notz, Michael A. Fligner
Publisher:
W. H. Freeman

Introduction to the Practice of Statistics
Statistics
ISBN:
9781319013387
Author:
David S. Moore, George P. McCabe, Bruce A. Craig
Publisher:
W. H. Freeman