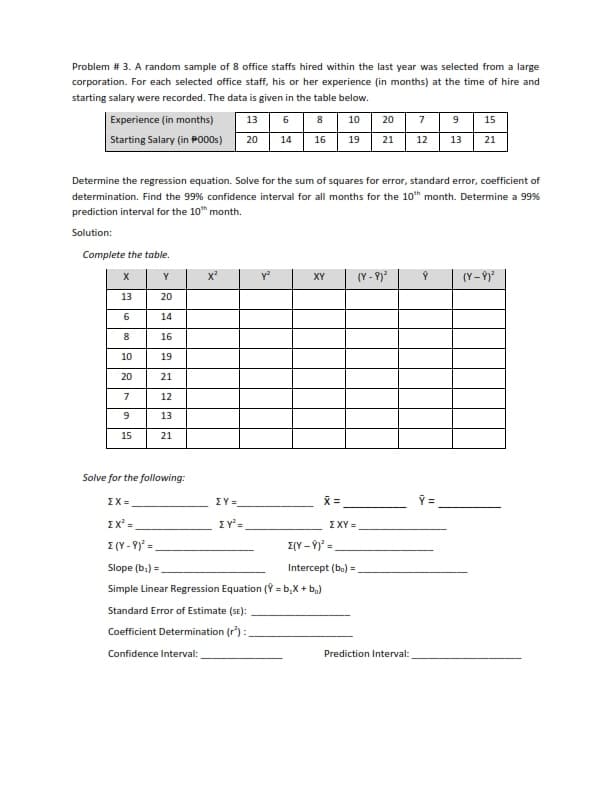
Problem # 3. A random sample of 8 office staffs hired within the last year was selected from a large corporation. For each selected office staff, his or her experience (in months) at the time of hire and starting salary were recorded. The data is given in the table below. Experience (in months) 13 6 8 10 20 7 9 15 Starting Salary (in P000s) 20 14 16 19 21 12 13 21 Determine the regression equation. Solve for the sum of squares for error, standard error, coefficient of determination. Find the 99% confidence interval for all months for the 10th month. Determine a 99% prediction interval for the 10th month. faluti
Q: The average amount of money spent for lunch per person in the college cafeteria is $7.25 and the…
A: Given Mean=7.25 Standard deviations=2.53 n=40
Q: average time period that spouses survive after the death of their partner is said to be greater for…
A:
Q: Do college students enjoy playing sports less than watching sports? A researcher randomly selected…
A: From the provided information, Sample size (n) = 10 Level of significance (α) = 0.10
Q: Use the accompanying set of dependent and independent variables to complete parts a through d below.…
A:
Q: 1. A coach is trying to see if a new had been using. Design a contro program.
A: In a controlled experiment all the variables in the study remain to be constant except one variable…
Q: i. What is the probability that there will be between 3 and 9 potholes in a given section of 5 km.…
A: Here we use poission distribution and exponential distribution
Q: The average IQ of a population is 100. A researcher wants to test whether a new medicine 'Think…
A:
Q: The average healing time of a certain type of incision is 264 hours, with standard deviation of 25…
A: Solution:- from given information Average =264 hrs standard deviation = 25hrs
Q: A chain of restaurants hes historically had a mean wait time of 9 minutes for its customers.…
A:
Q: CHI-SQUARE: 1. A record company wanted to survey its customers regarding music preferences. A random…
A: Step 2: Determine the level of significance. The level of significance(α) is stated from the…
Q: At a factory, certain metal components are manufactured on two different machines (A and B). The…
A: From the provided information, The claim is that machine B produces components that are stronger and…
Q: Use a 0.05 significance level to test the claim that the different samples come from populations…
A:
Q: The Journal de Botanique reported that the mean height of Begonias grown while being treated with a…
A:
Q: (a.) What is the parameter of interest in this study? (b.) Calculate the corresponding point…
A: Here Given Sample Size=n=200 Students No of students Who make at least one online Shopping in…
Q: Construct a 90% confidence interval of the population proportion using the given information. x=40,…
A: It is given that Sample size n = 200 Number of successes x = 40 The critical value of Z at 90%…
Q: What is the distribution of XX? XX ~ N(,) What is the distribution of ¯xx¯? ¯xx¯ ~ N(,) What is the…
A: We have given that Mean, μ = 962 Standard deviation, σ = 271 Sample size, n = 8 Note: According…
Q: binomial experiment is given. Decide whether you can use the normal distribution to approximate the…
A: Given that Sample size n =60 Population proportion p=55%=0.55
Q: From previous experience it is known that the percentage yield of a chemical process is normally…
A: The validity of the asserted interpretation regarding the true mean confidence interval (CI) is to…
Q: Given are five observations for two variables, and y. Yi The estimated regression equation for these…
A: Solution-: We have given estimated regression equation for the given data is Y^=0.9+2.7*X our aim to…
Q: For any sample of size 100, the population mean, the mean of the sampling distribution for the…
A:
Q: In order to estimate the percentage of adults who file their taxes at least two weeks before the…
A: The given 95% confidence interval is, 0.759 to 0.841 The values of sample proportion and margin of…
Q: الموضوع - 1 1 Example: Consider anormal distribution, N(0,4). The Simple hypothesis H.: 0-0 is…
A:
Q: Please calculate the SD of a sample of 8 data points using the formula taught in class. The…
A: We hava given that, ΣX2 = 5012.2, n = 8, x̄ = 24.0 Then, We will find the standard deviation (SD)…
Q: Given are five observations for two variables, and y. Use Table 2 of Appendix B. Ti 1 Yi 4 Round…
A: For the given data find all the required blanks
Q: Example 7.4 Calculate an appropriate measure of skewness from the following data: anden Value in Rs…
A:
Q: A simple random sample of size n = 40 is drawn from a population. The sample mean is found to be…
A: It is given that Sample size n = 40 Sample mean M = 121.4 Sample SD s = 12.4 The critical value of t…
Q: Suppose that the Cumulative distribution function (CDF) of the random variable X with parameter 0 >…
A: Result Var(X)=E(X2)-[E(X)]2
Q: What is the distribution of X? X ~ N(,) b. Find the probability that a randomly selected Private…
A:
Q: Given the model Y = B₁ + B₁X₁ + B2X2 + B3X3 + B4X4 + E What is the mean of our random error term?…
A: The model is defined as, Y = β0 + β1X1 + β2X2 + β3X3 + β4X4 + €.
Q: The linear correlation coefficient is r= 2. What are the null and alternative hypotheses? 3.…
A: Note: According to Bartleby expert guidelines, we can answer only first question with their three…
Q: A sales manager collected the following data on annual sales for new customer accounts and the…
A:
Q: ANSWER MUST BE IN WHOLE NUMBER 1. A study of 50 students showed that their average grade in science…
A: .
Q: The following data on price ($) and the overall score for 6 stereo headphones that were tested by…
A: For the given data find all the required blanks
Q: Suppose that 14 children, who were learning to ride two-wheel bikes, were surveyed to determine how…
A: The sample size is 14.
Q: b) Show that by using least square estimation, a and ß can be determined respectively as: n Σ(x₁ -…
A:
Q: In one last attempt to break Buckaroo, Lizardo has him do a magnitude estimation experiment where he…
A:
Q: Consider the following estimated trend models. Use them to make a forecast for t= 22. a. Linear…
A: Given t=22
Q: A psychologist is examining the influence of an older sibling in the development of social skills. A…
A:
Q: A real estate company is trying to estimate the cost of rent in Houston. They randomly sample 10…
A:
Q: State the Result: A hypothesis test was conducted at the alpha = 0.1 level of significance. The test…
A: Givenα=0.1p-value=0.033
Q: How many independent variables entered in the overall model and was/were not able to enter? What is…
A: We have given that the summary data in table form of the model.
Q: Assuming the population standard deviation is σ=0.4, construct a 89% confidence interval for the…
A: It is given that Sample size n = 17 Population SD = 0.4 Level of confidence = 0.89
Q: A random sample of 15 ECE graduates of a certain school design a schematic diagram of a given…
A: Confidence interval is used to measure the range where the true parameter lies. It is calculated by…
Q: Question 32 Which of the following assumptions is NOT needed for OLS estimators to be unbiased…
A: Disclaimer: Since you have asked multiple questions, we will solve the first question for you. If…
Q: Your house is in a community where for a certain reason, has many cases of fire. One action made by…
A: Points under consideration: The two stations are of equal distances from your city. Average…
Q: 4. Suppose X has a continuous uniform distribution over the interval [-1, 1] which has the…
A:
Q: nsity function of a random variable Y be y, f(y)=2-y, 2-y, 0≤x≤1 1<x<2 0, otherwise
A:
Q: If Y is a chi-square random variable with v degrees of freedom, then u = E(Y) = v and a = v(Y) = 2v.…
A: Given that If Y is a chi-square random variable with v degrees of freedom, then we have to proof…
Q: 3. The time between arrivals of buses at a particular bus stop in a suburban area is exponentially…
A:
Q: Angela recently discovered that the proportion of cat owners in Scranton, Pennsylvania, is 0.27.…
A: We have given that n = 200 p = 0.27
Step by step
Solved in 2 steps with 2 images
- Olympic Pole Vault The graph in Figure 7 indicates that in recent years the winning Olympic men’s pole vault height has fallen below the value predicted by the regression line in Example 2. This might have occurred because when the pole vault was a new event there was much room for improvement in vaulters’ performances, whereas now even the best training can produce only incremental advances. Let’s see whether concentrating on more recent results gives a better predictor of future records. (a) Use the data in Table 2 (page 176) to complete the table of winning pole vault heights shown in the margin. (Note that we are using x=0 to correspond to the year 1972, where this restricted data set begins.) (b) Find the regression line for the data in part ‚(a). (c) Plot the data and the regression line on the same axes. Does the regression line seem to provide a good model for the data? (d) What does the regression line predict as the winning pole vault height for the 2012 Olympics? Compare this predicted value to the actual 2012 winning height of 5.97 m, as described on page 177. Has this new regression line provided a better prediction than the line in Example 2?The following fictitious table shows kryptonite price, in dollar per gram, t years after 2006. t= Years since 2006 0 1 2 3 4 5 6 7 8 9 10 K= Price 56 51 50 55 58 52 45 43 44 48 51 Make a quartic model of these data. Round the regression parameters to two decimal places.Problem 2 The following printout shows the results of a simple linear regression model that predicts monthly sales (in thousands of dollars) based on how much money was spent on advertising (in thousands of dollars) during a particular month for 15 stores of a retail chain. a) Is there a statistically significant relationship between money spent on advertising and sales? Test at the 5% level of significance and explain your approach (including hypotheses). b) Somebody claims that every additional $1,000 in advertising will increase sales by more than $2,000 in the population. Can you find support for this claim given the results of your analysis? Test at the 5% level of significance and explain your approach (including hypotheses). How is this test different from the one in part a)? c) Find a 95% confidence interval for the change in sales given a $1,000 increase in the amount of money spent on advertising. How does this confidence interval relate to your answer to part a)?
- QUESTION 2 XXX Electric Illuminating Company is doing a survey on the relationship between electricity used in kilowatt-hours (thousand) and the number of rooms in a private single-family residence. A random sample of 10 homes was selected and the electricity consumption recorded as below. ii. Find a suitable linear regression equation ? = ? + ??. iii. Determine the number of kilowatt-hours (thousand) for an eleven-room residence.The operations manager of a musical instrument distributor feels that the demand for Bass Drums may be related to the number of television appearances by the popular rick group Green Shades during the previous month. The manager has collected the data shown in the following table. Demand for Bass Drums 3 6 7 5 10 8 Green Shades TV appearances 3 4 7 6 8 5 Develop the linear regression equation to forecast. Forecast demand for Bass Drums when Green Shades’ TV appearances are 10. Compute MSE and standard deviation for Problem 8.Question 16 Regression analysis was applied between sales (in $1000s) and advertising (in $100s), and the following regression function was obtained. = 500 + 4x Based on the above estimated regression line, if advertising is $10,000, then the point estimate for sales (in dollars) is _____. $505,000 $900 $40,500 $900,000
- Do students with higher college grade point averages (GPAs) earn more than those graduates with lower GPAs?† Consider the following hypothetical college GPA and salary data (10 years after graduation). GPA Salary ($) 2.22 72,000 2.29 48,000 2.57 72,000 2.59 64,000 2.77 88,000 2.85 98,000 3.12 133,000 3.35 130,000 3.66 157,000 3.68 162,000 Use these data to develop an estimated regression equation that can be used to predict annual salary 10 years after graduation given college GPA. (Let x = GPA, and let y = salary (in $). Round your numerical values to the nearest integer.) ŷ = Find the value of the test statistic. (Round your answer to two decimal places.) = Find the p-value. (Round your answer to three decimal places.) p-value =Problem 2: You have to examine the relationship between the age and price for used cars sold in the last year by a car dealership company to build a predictive linear regression model. The age of the car is the independent variable for your model. Here is the table of the data: Car Age in Years Price in Dollars 4 6,300 4 5,800 5 5,700 5 4,500 7 4,500 7 4,200 8 4,100 9 3,100 10 2,100 11 2,500 12 2,200 What would we expect for the price of an 8.5 year-old car?given the information below: Row Education Income in in Years 2015 Dollars 1 7 22587 2 10 28305 3 12 40196 4 13 49483 5 14 54483 6 16 78073 7 18 99540 8 19 155646 9 21 125310 1. Estimate the regression equation Income = a + b(Education). 2. What is the predicted increase in Income for a one-year increase in Education? 3. What do you predict Income to be for a person who has 17 years of education? 4. How much of the variation in Income is explained (or accounted for) by Education?
- Question 9 Assume a regression analysis yields a regression line with the value Y=$120,000 + $0.58X, where Y equals plant labor costs and X equals dollars of production output. If the company plans to produce $2,400,000 of product during the upcoming month, it would project plant labor costs to be: a. $324,000 b. $120,000 c. $204,000 d. $2,400,000question 26 What is the relationship between the number of minutes per day a woman spends talking on the phone and the woman's weight? The time on the phone and weight for 8 women are shown in the table below. Time 54 88 82 61 39 40 84 83 Pounds 149 198 184 166 142 140 170 163 The equation of the linear regression line is: ˆyy^ = ?+ x (Please show your answers to 3 decimal places) Use the model to predict the weight of a woman who spends 50 minutes on the phone.Weight = ? (Please round your answer to the nearest whole number.) Interpret the slope of the regression line in the context of the question: For every additional minute women spend on the phone, they tend to weigh on averge 0.87 additional pounds. As x goes up, y goes up. The slope has no practical meaning since you cannot predict a women's weight. Interpret the y-intercept in the context of the question: The y-intercept has no practical meaning for this study. The average woman's weight is…Questions 1-30 refer to the following scenario: A company reports bi-annual (twice a year) sales data. The sales data for the last three years is shown in below Table. Why would it be a bad idea to use the linear regression line to make forecasts when looking at the data? a The linear trend line does not capture the fact that, on average, sales go up. b The linear trend line does not capture the seasonality of the data. c Both a. and b. are correct. d None of the above. Decomposition forecasting decomposes data into which two factors? a Slope and intercept b Trend and seasonality c Past and future data d Decom and position In decomposition forecasting, the calculated seasonal index for the first bi-annual period is a 0.71 b 1.29 c 0.89 d 1.41 In decomposition forecasting, the calculated seasonal index for the second bi-annual period is a 0.89 b 0.71 c 1.41 d 1.29 Using only the regression line, the…