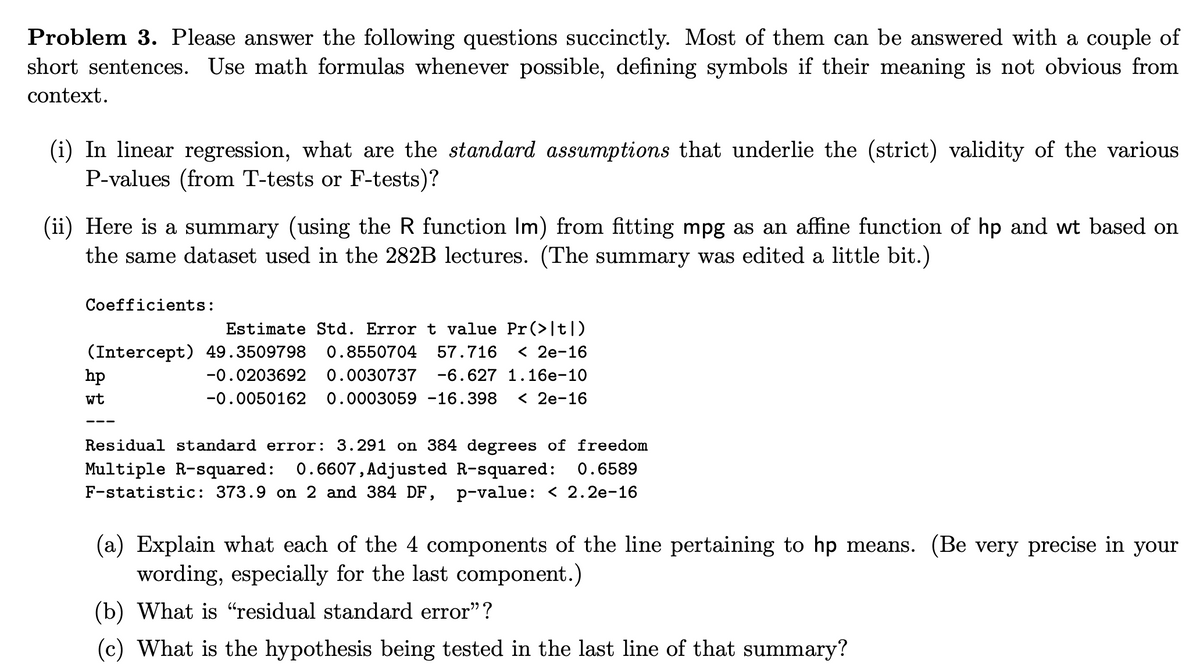
Problem 3. Please answer the following questions succinctly. Most of them can be answered with a couple of short sentences. Use math formulas whenever possible, defining symbols if their meaning is not obvious from context. (i) In linear regression, what are the standard assumptions that underlie the (strict) validity of the various P-values (from T-tests or F-tests)? (ii) Here is a summary (using the R function Im) from fitting mpg as an affine function of hp and wt based on the same dataset used in the 282B lectures. (The summary was edited a little bit.) Coefficients: Estimate Std. Error t value Pr(>|t|) (Intercept) 49.3509798 0.8550704 57.716 <2e-16 -0.0203692 0.0030737 -6.627 1.16e-10 -0.0050162 0.0003059 -16.398 < 2e-16 hp wt --- Residual standard error: 3.291 on 384 degrees of freedom Multiple R-squared: 0.6607, Adjusted R-squared: 0.6589 F-statistic: 373.9 on 2 and 384 DF, p-value: < 2.2e-16 (a) Explain what each of the 4 components of the line pertaining to hp means. (Be very precise in your wording, especially for the last component.) (b) What is "residual standard error"? (c) What is the hypothesis being tested in the last line of that summary?
Problem 3. Please answer the following questions succinctly. Most of them can be answered with a couple of short sentences. Use math formulas whenever possible, defining symbols if their meaning is not obvious from context. (i) In linear regression, what are the standard assumptions that underlie the (strict) validity of the various P-values (from T-tests or F-tests)? (ii) Here is a summary (using the R function Im) from fitting mpg as an affine function of hp and wt based on the same dataset used in the 282B lectures. (The summary was edited a little bit.) Coefficients: Estimate Std. Error t value Pr(>|t|) (Intercept) 49.3509798 0.8550704 57.716 <2e-16 -0.0203692 0.0030737 -6.627 1.16e-10 -0.0050162 0.0003059 -16.398 < 2e-16 hp wt --- Residual standard error: 3.291 on 384 degrees of freedom Multiple R-squared: 0.6607, Adjusted R-squared: 0.6589 F-statistic: 373.9 on 2 and 384 DF, p-value: < 2.2e-16 (a) Explain what each of the 4 components of the line pertaining to hp means. (Be very precise in your wording, especially for the last component.) (b) What is "residual standard error"? (c) What is the hypothesis being tested in the last line of that summary?

MATLAB: An Introduction with Applications
6th Edition
ISBN:9781119256830
Author:Amos Gilat
Publisher:Amos Gilat
Chapter1: Starting With Matlab
Section: Chapter Questions
Problem 1P

Related questions
Question
Transcribed Image Text:Problem 3. Please answer the following questions succinctly. Most of them can be answered with a couple of
short sentences. Use math formulas whenever possible, defining symbols if their meaning is not obvious from
context.
(i) In linear regression, what are the standard assumptions that underlie the (strict) validity of the various
P-values (from T-tests or F-tests)?
(ii) Here is a summary (using the R function lm) from fitting mpg as an affine function of hp and wt based on
the same dataset used in the 282B lectures. (The summary was edited a little bit.)
Coefficients:
Estimate Std. Error t value Pr(>|t|)
(Intercept) 49.3509798 0.8550704 57.716 < 2e-16
-0.0203692 0.0030737 -6.627 1.16e-10
-0.0050162 0.0003059 -16.398 < 2e-16
hp
wt
Residual standard error: 3.291 on 384 degrees of freedom
Multiple R-squared: 0.6607, Adjusted R-squared: 0.6589
F-statistic: 373.9 on 2 and 384 DF, p-value: < 2.2e-16
(a) Explain what each of the 4 components of the line pertaining to hp means. (Be very precise in your
wording, especially for the last component.)
(b) What is "residual standard error"?
(c) What is the hypothesis being tested in the last line of that summary?
Transcribed Image Text:(iii) Linear dependencies (multicollinearity) in the predictor variables can be problematic. Explain why.
(iv) Estimating the coefficient vector in a linear model by least absolute regression (LAR) amounts to performing
maximum likelihood estimation... under what assumption(s)?
(v) Suppose one of our predictor variables is a factor with 5 levels. How is it incorporated in the linear model?
(Do not include interactions of that factor with other predictor variables.)
(vi) Write down the general form of an M-estimator. (Assume you have data (xi, Yi), i = 1, ..., n and define any
other math variable that you use.)
(vii) Write down a logistic model for predicting a binary response y = {0, 1} based on an affine function of a
predictor vector x E RP. What are the link function and the variance function in this case?
(viii) Write down the smoothing splines criterion (meaning, the optimization problem) for fitting E(y|x) = f(x)
on bivariate numerical data (x1, y₁),..., (xn, Yn).
(ix) Explain in words (briefly) how to choose the tuning parameter of smoothing splines by cross-validation.
Expert Solution
This question has been solved!
Explore an expertly crafted, step-by-step solution for a thorough understanding of key concepts.

Step by step
Solved in 6 steps with 2 images

Recommended textbooks for you
MATLAB: An Introduction with Applications
Statistics
ISBN:
9781119256830
Author:
Amos Gilat
Publisher:
John Wiley & Sons Inc

Probability and Statistics for Engineering and th…
Statistics
ISBN:
9781305251809
Author:
Jay L. Devore
Publisher:
Cengage Learning

Statistics for The Behavioral Sciences (MindTap C…
Statistics
ISBN:
9781305504912
Author:
Frederick J Gravetter, Larry B. Wallnau
Publisher:
Cengage Learning
MATLAB: An Introduction with Applications
Statistics
ISBN:
9781119256830
Author:
Amos Gilat
Publisher:
John Wiley & Sons Inc
Probability and Statistics for Engineering and th…
Statistics
ISBN:
9781305251809
Author:
Jay L. Devore
Publisher:
Cengage Learning
Statistics for The Behavioral Sciences (MindTap C…
Statistics
ISBN:
9781305504912
Author:
Frederick J Gravetter, Larry B. Wallnau
Publisher:
Cengage Learning

Elementary Statistics: Picturing the World (7th E…
Statistics
ISBN:
9780134683416
Author:
Ron Larson, Betsy Farber
Publisher:
PEARSON

The Basic Practice of Statistics
Statistics
ISBN:
9781319042578
Author:
David S. Moore, William I. Notz, Michael A. Fligner
Publisher:
W. H. Freeman

Introduction to the Practice of Statistics
Statistics
ISBN:
9781319013387
Author:
David S. Moore, George P. McCabe, Bruce A. Craig
Publisher:
W. H. Freeman