Problem 4 A company producing electric cars advertise a reach of 500 km for a certain model. On suspicion that the company was exaggerating the reach in their advertising, an independent test was done on six different cars. The test gave the following reach in km. We assume that the reach of electric cars follows a normal distribution. 465, 460, 490, 480, 470, 485 a) What are the sample mean and sample standard deviation? b) Estimate a 95 % two tailed confidence interval for the population mean. c) Use a t-test to determine whether there is reason to believe that the company has been exaggerating the car's reach (even though the sample is small). Test at the 5 % level. d) Show how you conclude using a diagram.
Problem 4 A company producing electric cars advertise a reach of 500 km for a certain model. On suspicion that the company was exaggerating the reach in their advertising, an independent test was done on six different cars. The test gave the following reach in km. We assume that the reach of electric cars follows a normal distribution. 465, 460, 490, 480, 470, 485 a) What are the sample mean and sample standard deviation? b) Estimate a 95 % two tailed confidence interval for the population mean. c) Use a t-test to determine whether there is reason to believe that the company has been exaggerating the car's reach (even though the sample is small). Test at the 5 % level. d) Show how you conclude using a diagram.

Glencoe Algebra 1, Student Edition, 9780079039897, 0079039898, 2018
18th Edition
ISBN:9780079039897
Author:Carter
Publisher:Carter
Chapter10: Statistics
Section10.4: Distributions Of Data
Problem 19PFA

Related questions
Topic Video
Question
100%
Transcribed Image Text:Proble m 4
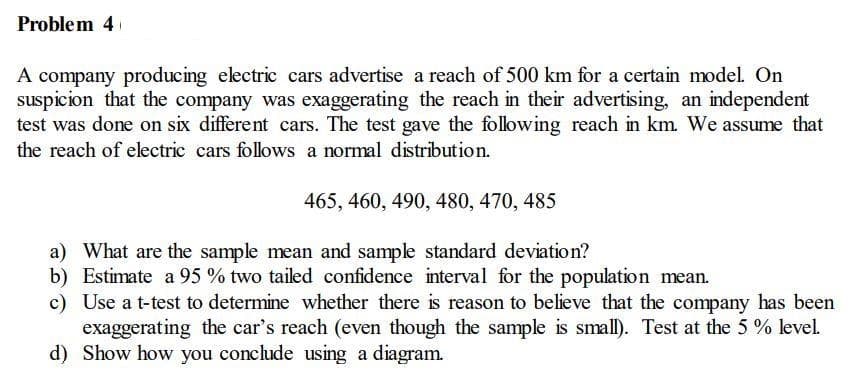
A company producing electric cars advertise a reach of 500 km for a certain model. On
suspicion that the company was exaggerating the reach in their advertising, an independent
test was done on six different cars. The test gave the following reach in km. We assume that
the reach of electric cars follows a normal distribution.
465, 460, 490, 480, 470, 485
a) What are the sample mean and sample standard deviation?
b) Estimate a 95 % two tailed confidence interval for the population mean.
c) Use a t-test to determine whether there is reason to believe that the company has been
exaggerating the car's reach (even though the sample is small). Test at the 5 % level.
d) Show how you conclude using a diagram.
Expert Solution
This question has been solved!
Explore an expertly crafted, step-by-step solution for a thorough understanding of key concepts.

Step by step
Solved in 2 steps with 4 images

Knowledge Booster


Learn more about
Need a deep-dive on the concept behind this application? Look no further. Learn more about this topic, statistics and related others by exploring similar questions and additional content below.Recommended textbooks for you
Glencoe Algebra 1, Student Edition, 9780079039897…
Algebra
ISBN:
9780079039897
Author:
Carter
Publisher:
McGraw Hill
Glencoe Algebra 1, Student Edition, 9780079039897…
Algebra
ISBN:
9780079039897
Author:
Carter
Publisher:
McGraw Hill