Question 1 <> In an election, suppose that 60% of voters support a school levy increase. If we poll 148 of these voters at random, the probability distribution for the proportion of the polled voters that support a school levy increase can be modeled by the normal distribution pictured below. The bell curve below represents the distribution of these sample proportions. The scale on the horizontal axis is the standard deviation of the sampling distribution. So each tick mark represents a distance of one standard deviation on the distribution, with the middle tick mark being the mean of the distribution. Complete the boxes accurate to two decimal places. Please carefully note where the boxes are located on the horizontal axis. Complete the boxes accurate to two decimal places.
Question 1 <> In an election, suppose that 60% of voters support a school levy increase. If we poll 148 of these voters at random, the probability distribution for the proportion of the polled voters that support a school levy increase can be modeled by the normal distribution pictured below. The bell curve below represents the distribution of these sample proportions. The scale on the horizontal axis is the standard deviation of the sampling distribution. So each tick mark represents a distance of one standard deviation on the distribution, with the middle tick mark being the mean of the distribution. Complete the boxes accurate to two decimal places. Please carefully note where the boxes are located on the horizontal axis. Complete the boxes accurate to two decimal places.

MATLAB: An Introduction with Applications
6th Edition
ISBN:9781119256830
Author:Amos Gilat
Publisher:Amos Gilat
Chapter1: Starting With Matlab
Section: Chapter Questions
Problem 1P

Related questions
Question
Transcribed Image Text:Question 1
<>
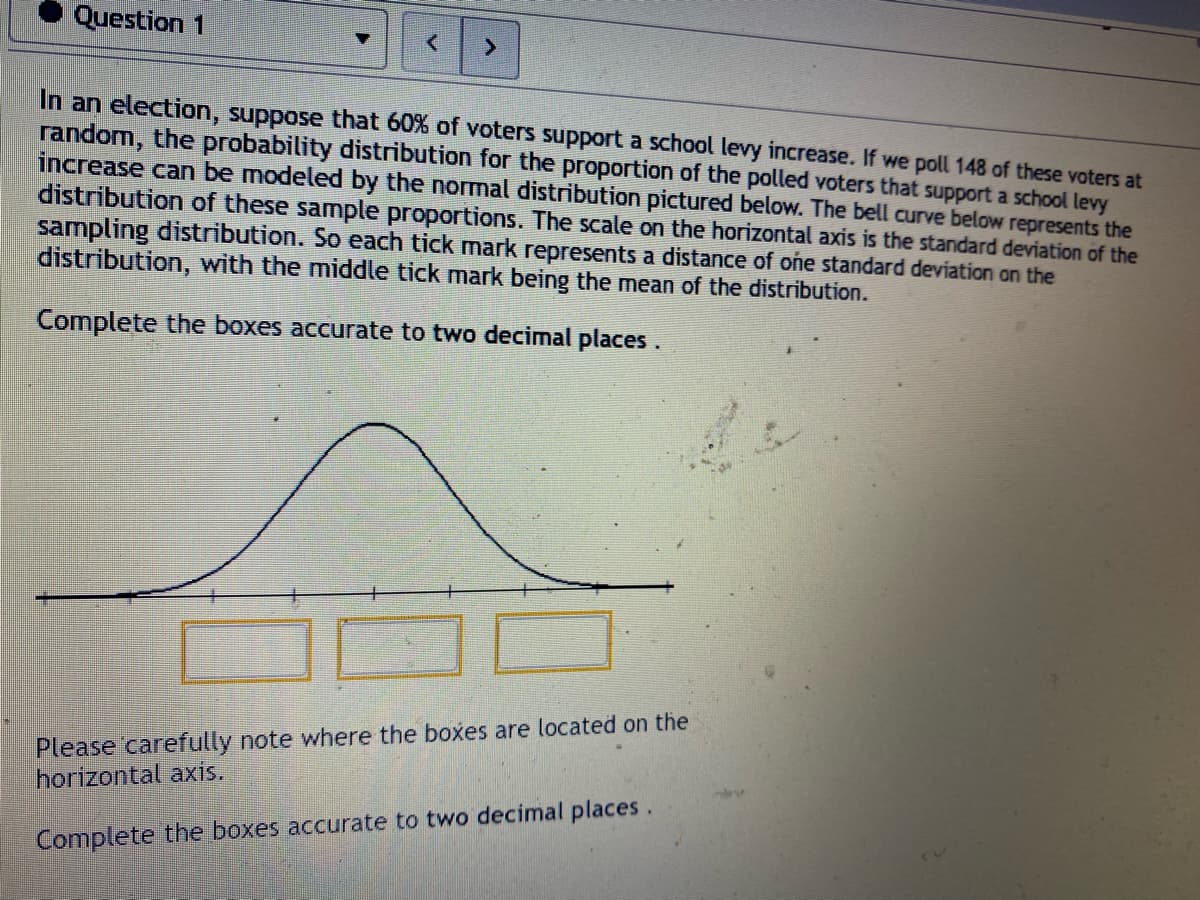
In an election, suppose that 60% of voters support a school levy increase. If we poll 148 of these voters at
random, the probability distribution for the proportion of the polled voters that support a school levy
increase can be modeled by the normal distribution pictured below.. The bell curve below represents the
distribution of these sample proportions. The scale on the horizontal axis is the standard deviation of the
sampling distribution. So each tick mark represents a distance of one standard deviation on the
distribution, with the middle tick mark being the mean of the distribution.
Complete the boxes accurate to two decimal places.
Please carefully note where the boxes are located on the
horizontal axis.
Complete the boxes accurate to two decimal places.
Expert Solution
This question has been solved!
Explore an expertly crafted, step-by-step solution for a thorough understanding of key concepts.

This is a popular solution!

Trending now
This is a popular solution!

Step by step
Solved in 2 steps with 2 images

Recommended textbooks for you
MATLAB: An Introduction with Applications
Statistics
ISBN:
9781119256830
Author:
Amos Gilat
Publisher:
John Wiley & Sons Inc

Probability and Statistics for Engineering and th…
Statistics
ISBN:
9781305251809
Author:
Jay L. Devore
Publisher:
Cengage Learning

Statistics for The Behavioral Sciences (MindTap C…
Statistics
ISBN:
9781305504912
Author:
Frederick J Gravetter, Larry B. Wallnau
Publisher:
Cengage Learning
MATLAB: An Introduction with Applications
Statistics
ISBN:
9781119256830
Author:
Amos Gilat
Publisher:
John Wiley & Sons Inc
Probability and Statistics for Engineering and th…
Statistics
ISBN:
9781305251809
Author:
Jay L. Devore
Publisher:
Cengage Learning
Statistics for The Behavioral Sciences (MindTap C…
Statistics
ISBN:
9781305504912
Author:
Frederick J Gravetter, Larry B. Wallnau
Publisher:
Cengage Learning

Elementary Statistics: Picturing the World (7th E…
Statistics
ISBN:
9780134683416
Author:
Ron Larson, Betsy Farber
Publisher:
PEARSON

The Basic Practice of Statistics
Statistics
ISBN:
9781319042578
Author:
David S. Moore, William I. Notz, Michael A. Fligner
Publisher:
W. H. Freeman

Introduction to the Practice of Statistics
Statistics
ISBN:
9781319013387
Author:
David S. Moore, George P. McCabe, Bruce A. Craig
Publisher:
W. H. Freeman