Problem 9 According to the federal government, 24% of workers covered by their company's health care plan were not required to contribute to the premium (Statistical Abstract of the UnitedStates: 2006). A recent study found that 81 out of 400 workers sampled were not required to contribute to their company's health care plan. Has the percent of workers not required to contribute to their company's health plan decreased? Test at the 99% confidence level.
Problem 9 According to the federal government, 24% of workers covered by their company's health care plan were not required to contribute to the premium (Statistical Abstract of the UnitedStates: 2006). A recent study found that 81 out of 400 workers sampled were not required to contribute to their company's health care plan. Has the percent of workers not required to contribute to their company's health plan decreased? Test at the 99% confidence level.

Glencoe Algebra 1, Student Edition, 9780079039897, 0079039898, 2018
18th Edition
ISBN:9780079039897
Author:Carter
Publisher:Carter
Chapter4: Equations Of Linear Functions
Section: Chapter Questions
Problem 8SGR

Related questions
Topic Video
Question

Transcribed Image Text:Problem 9
According to the federal government, 24% of workers covered by their company's health care plan were not
required to contribute to the premium (Statistical Abstract of the UnitedStates: 2006). A recent study found that
81 out of 400 workers sampled were not required to contribute to their company's health care plan. Has the
percent of workers not required to contribute to their company's health plan decreased? Test at the 99%
confidence level.
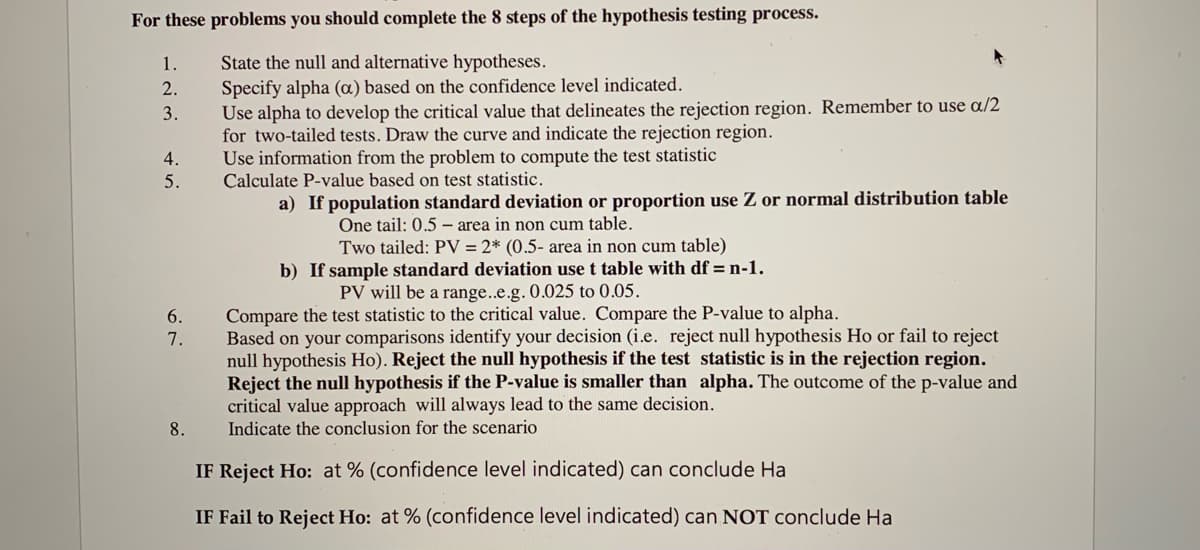
Transcribed Image Text:For these problems you should complete the 8 steps of the hypothesis testing process.
State the null and alternative hypotheses.
Specify alpha (a) based on the confidence level indicated.
Use alpha to develop the critical value that delineates the rejection region. Remember to use a/2
for two-tailed tests. Draw the curve and indicate the rejection region.
Use information from the problem to compute the test statistic
Calculate P-value based on test statistic.
1.
2.
3.
4.
5.
a) If population standard deviation or proportion use Z or normal distribution table
One tail: 0.5 – area in non cum table.
Two tailed: PV = 2* (0.5- area in non cum table)
b) If sample standard deviation use t table with df = n-1.
PV will be a range..e.g. 0.025 to 0.05.
Compare the test statistic to the critical value. Compare the P-value to alpha.
Based on your comparisons identify your decision (i.e. reject null hypothesis Ho or fail to reject
null hypothesis Ho). Reject the null hypothesis if the test statistic is in the rejection region.
Reject the null hypothesis if the P-value is smaller than alpha. The outcome of the p-value and
critical value approach will always lead to the same decision.
Indicate the conclusion for the scenario
6.
7.
8.
IF Reject Ho: at % (confidence level indicated) can conclude Ha
IF Fail to Reject Ho: at % (confidence level indicated) can NOT conclude Ha
Expert Solution
This question has been solved!
Explore an expertly crafted, step-by-step solution for a thorough understanding of key concepts.

This is a popular solution!

Trending now
This is a popular solution!

Step by step
Solved in 4 steps with 3 images

Knowledge Booster


Learn more about
Need a deep-dive on the concept behind this application? Look no further. Learn more about this topic, probability and related others by exploring similar questions and additional content below.Recommended textbooks for you
Glencoe Algebra 1, Student Edition, 9780079039897…
Algebra
ISBN:
9780079039897
Author:
Carter
Publisher:
McGraw Hill

College Algebra (MindTap Course List)
Algebra
ISBN:
9781305652231
Author:
R. David Gustafson, Jeff Hughes
Publisher:
Cengage Learning
Glencoe Algebra 1, Student Edition, 9780079039897…
Algebra
ISBN:
9780079039897
Author:
Carter
Publisher:
McGraw Hill
College Algebra (MindTap Course List)
Algebra
ISBN:
9781305652231
Author:
R. David Gustafson, Jeff Hughes
Publisher:
Cengage Learning