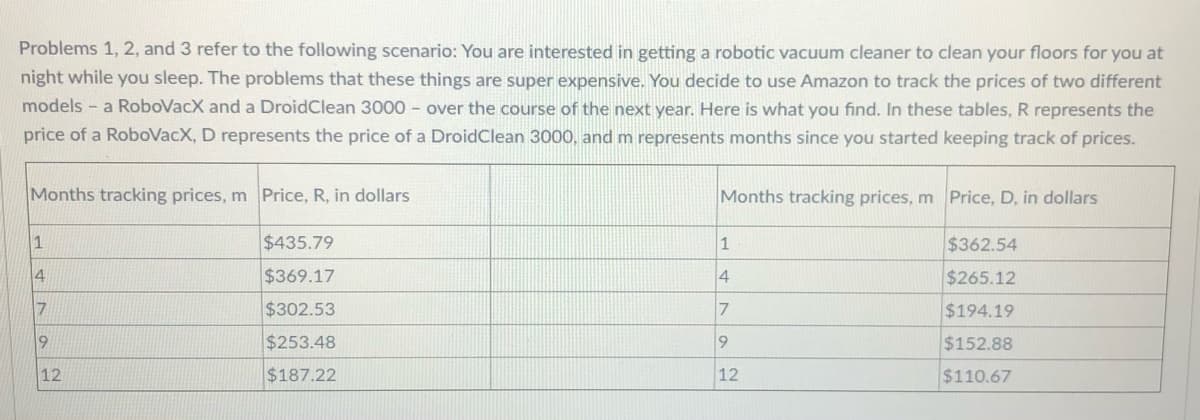
Problems 1, 2, and 3 refer to the following scenario: You are interested in getting a robotic vacuum cleaner to clean your floors for you at night while you sleep. The problems that these things are super expensive. You decide to use Amazon to track the prices of two different models - a RoboVacX and a DroidClean 3000 - over the course of the next year. Here is what you find. In these tables, R represents the price of a RoboVacX, D represents the price of a DroidClean 3000, and m represents months since you started keeping track of prices. Months tracking prices, m Price, R, in dollars Months tracking prices, m Price, D, in dollars 1 $435.79 $362.54 14 $369.17 4 $265.12 $302.53 $194.19 9 $253.48 $152.88 12 $187.22 12 $110.67


Correlation
Correlation defines a relationship between two independent variables. It tells the degree to which variables move in relation to each other. When two sets of data are related to each other, there is a correlation between them.
Linear Correlation
A correlation is used to determine the relationships between numerical and categorical variables. In other words, it is an indicator of how things are connected to one another. The correlation analysis is the study of how variables are related.
Regression Analysis
Regression analysis is a statistical method in which it estimates the relationship between a dependent variable and one or more independent variable. In simple terms dependent variable is called as outcome variable and independent variable is called as predictors. Regression analysis is one of the methods to find the trends in data. The independent variable used in Regression analysis is named Predictor variable. It offers data of an associated dependent variable regarding a particular outcome.

Step by step
Solved in 4 steps


