PROCEDURE: A. Given the observed values below, is there an agreement between the expected and observed ratios? Does it fit the 3:1 ratio? State the reason behind. Phenotypes (Purple is dominant Observed values over yellow corn) Purple com 175 Yellow corn 52
PROCEDURE: A. Given the observed values below, is there an agreement between the expected and observed ratios? Does it fit the 3:1 ratio? State the reason behind. Phenotypes (Purple is dominant Observed values over yellow corn) Purple com 175 Yellow corn 52

Mathematics For Machine Technology
8th Edition
ISBN:9781337798310
Author:Peterson, John.
Publisher:Peterson, John.
Chapter29: Tolerance, Clearance, And Interference
Section: Chapter Questions
Problem 16A: Spacers are manufactured to the mean dimension and tolerance shown in Figure 29-12. An inspector...

Related questions
Question
Transcribed Image Text:Name:
RATING:
Schedule:
Date Submitted:
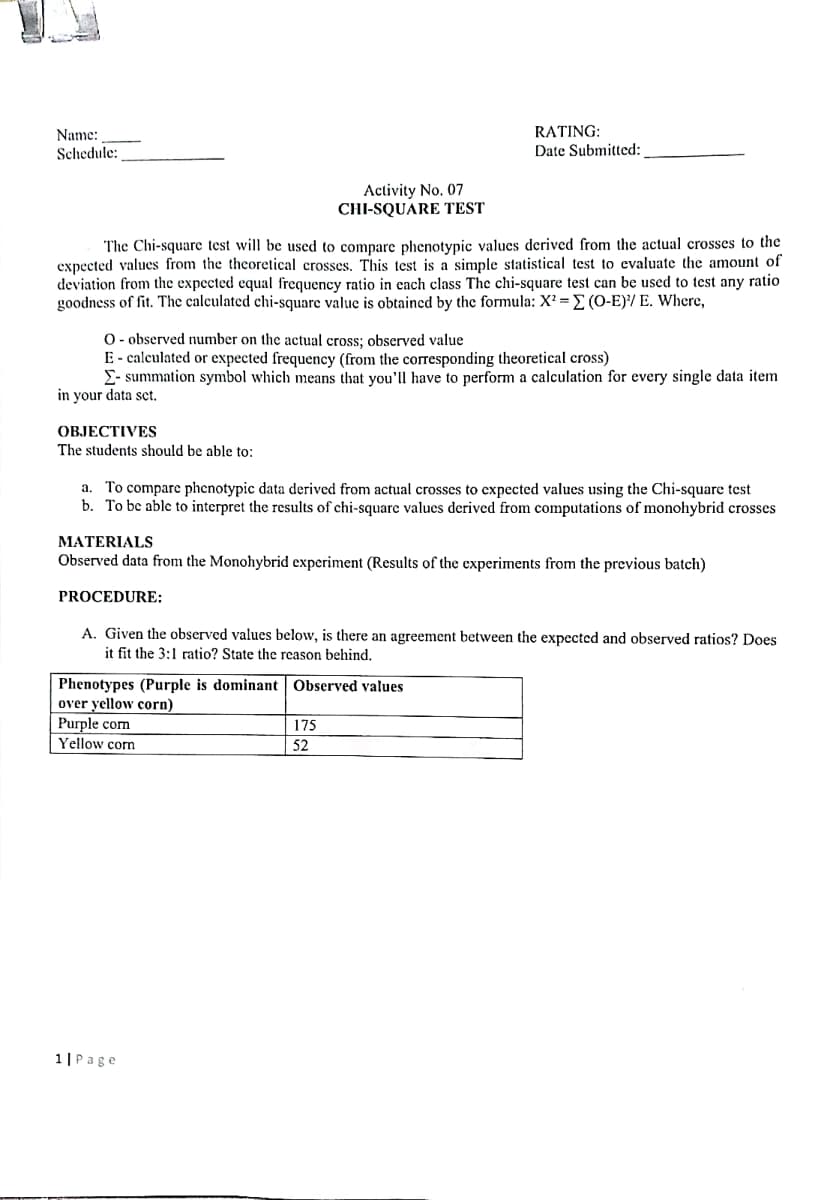
Activity No. 07
CHI-SQUARE TEST
The Chi-square test will be used to compare phenotypic values derived from the actual crosses to the
expected values from the theoretical crosses. This test is a simple statistical test to evaluate the amount of
deviation from the expected equal frequency ratio in each class The chi-square test can be used to test any ratio
goodness of fit. The calculated chi-square value is obtained by the formula: X? = E (O-E)/ E. Where,
O- observed number on the actual cross; observed value
E- calculated or expected frequency (from the corresponding theoretical cross)
E- summation symbol which means that you'll have to perform a calculation for every single data item
in your data sct.
OBJECTIVES
The students should be able to:
To compare phenotypic data derived from actual crosses to expected values using the Chi-square test
b. To bc able to interpret the results of chi-square values derived from computations of monohybrid crosses
a.
MATERIALS
Observed data from the Monohybrid experiment (Results of the experiments from the previous batch)
PROCEDURE:
A. Given the observed values below, is there an agreement between the expected and observed ratios? Does
it fit the 3:1 ratio? State the reason behind.
Phenotypes (Purple is dominant Observed values
over yellow corn)
Purple com
175
|52
Yellow corn
1|Page
Expert Solution
This question has been solved!
Explore an expertly crafted, step-by-step solution for a thorough understanding of key concepts.

Step by step
Solved in 3 steps

Recommended textbooks for you
Mathematics For Machine Technology
Advanced Math
ISBN:
9781337798310
Author:
Peterson, John.
Publisher:
Cengage Learning,

Glencoe Algebra 1, Student Edition, 9780079039897…
Algebra
ISBN:
9780079039897
Author:
Carter
Publisher:
McGraw Hill

Holt Mcdougal Larson Pre-algebra: Student Edition…
Algebra
ISBN:
9780547587776
Author:
HOLT MCDOUGAL
Publisher:
HOLT MCDOUGAL
Mathematics For Machine Technology
Advanced Math
ISBN:
9781337798310
Author:
Peterson, John.
Publisher:
Cengage Learning,
Glencoe Algebra 1, Student Edition, 9780079039897…
Algebra
ISBN:
9780079039897
Author:
Carter
Publisher:
McGraw Hill
Holt Mcdougal Larson Pre-algebra: Student Edition…
Algebra
ISBN:
9780547587776
Author:
HOLT MCDOUGAL
Publisher:
HOLT MCDOUGAL