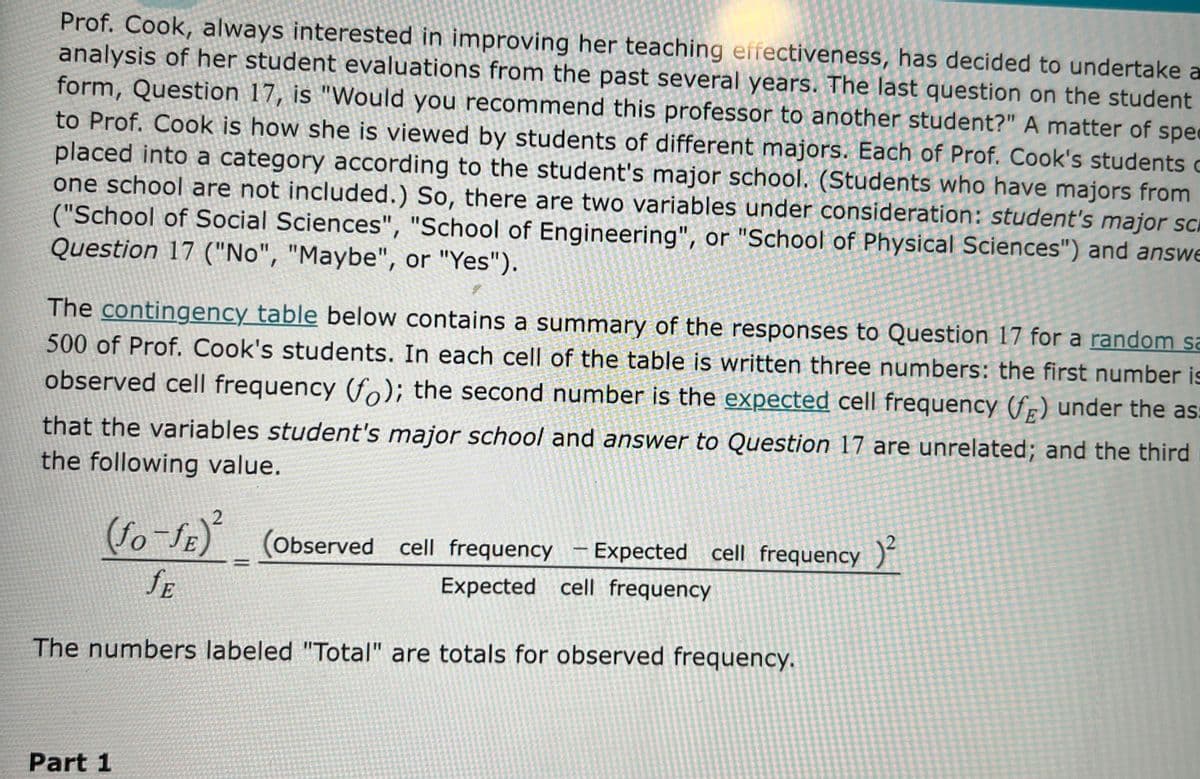
Prof. Cook, always interested in improving her teaching effectiveness, has decided to undertake a analysis of her student evaluations from the past several years. The last question on the student form, Question 17, is "Would you recommend this professor to another student?" A matter of spee to Prof. Cook is how she is viewed by students of different majors. Each of Prof. Cook's students c placed into a category according to the student's major school. (Students who have majors from one school are not included.) So, there are two variables under consideration: student's major sc ("School of Social Sciences", "School of Engineering", or "School of Physical Sciences") and answe Question 17 ("No", "Maybe", or "Yes"). The contingency table below contains a summary of the responses to Question 17 for a random sa 500 of Prof. Cook's students. In each cell of the table is written three numbers: the first number is observed cell frequency (fo); the second number is the expected cell frequency (fg) under the as: that the variables student's major school and answer to Question 17 are unrelated; and the third the following value. (fo-fE) (Observed cell frequency Expected cell frequency ) SE Expected cell frequency The numbers labeled "Total" are totals for observed frequency.
Prof. Cook, always interested in improving her teaching effectiveness, has decided to undertake a analysis of her student evaluations from the past several years. The last question on the student form, Question 17, is "Would you recommend this professor to another student?" A matter of spee to Prof. Cook is how she is viewed by students of different majors. Each of Prof. Cook's students c placed into a category according to the student's major school. (Students who have majors from one school are not included.) So, there are two variables under consideration: student's major sc ("School of Social Sciences", "School of Engineering", or "School of Physical Sciences") and answe Question 17 ("No", "Maybe", or "Yes"). The contingency table below contains a summary of the responses to Question 17 for a random sa 500 of Prof. Cook's students. In each cell of the table is written three numbers: the first number is observed cell frequency (fo); the second number is the expected cell frequency (fg) under the as: that the variables student's major school and answer to Question 17 are unrelated; and the third the following value. (fo-fE) (Observed cell frequency Expected cell frequency ) SE Expected cell frequency The numbers labeled "Total" are totals for observed frequency.

Glencoe Algebra 1, Student Edition, 9780079039897, 0079039898, 2018
18th Edition
ISBN:9780079039897
Author:Carter
Publisher:Carter
Chapter10: Statistics
Section10.6: Summarizing Categorical Data
Problem 27PPS

Related questions
Question
Transcribed Image Text:Prof. Cook, always interested in improving her teaching effectiveness, has decided to undertake a
analysis of her student evaluations from the past several years. The last question on the student
form, Question 17, is "Would you recommend this professor to another student?" A matter of spec
to Prof. Cook is how she is viewed by students of different majors. Each of Prof. Cook's students c
placed into a category according to the student's major school. (Students who have majors from
one school are not included.) So, there are two variables under consideration: student's major scr
("School of Social Sciences", "School of Engineering", or "School of Physical Sciences") and answe
Question 17 ("No", "Maybe", or "Yes").
The contingency table below contains a summary of the responses to Question 17 for a random sa
500 of Prof. Cook's students. In each cell of the table is written three numbers: the first number is
observed cell frequency (fo); the second number is the expected cell frequency (fr) under the as:
that the variables student's major school and answer to Question 17 are unrelated; and the third
the following value.
fo-SE (observed cell frequency -Expected cell frequency )
JE
Expected cell frequency
The numbers labeled "Total" are totals for observed frequency.
Part 1
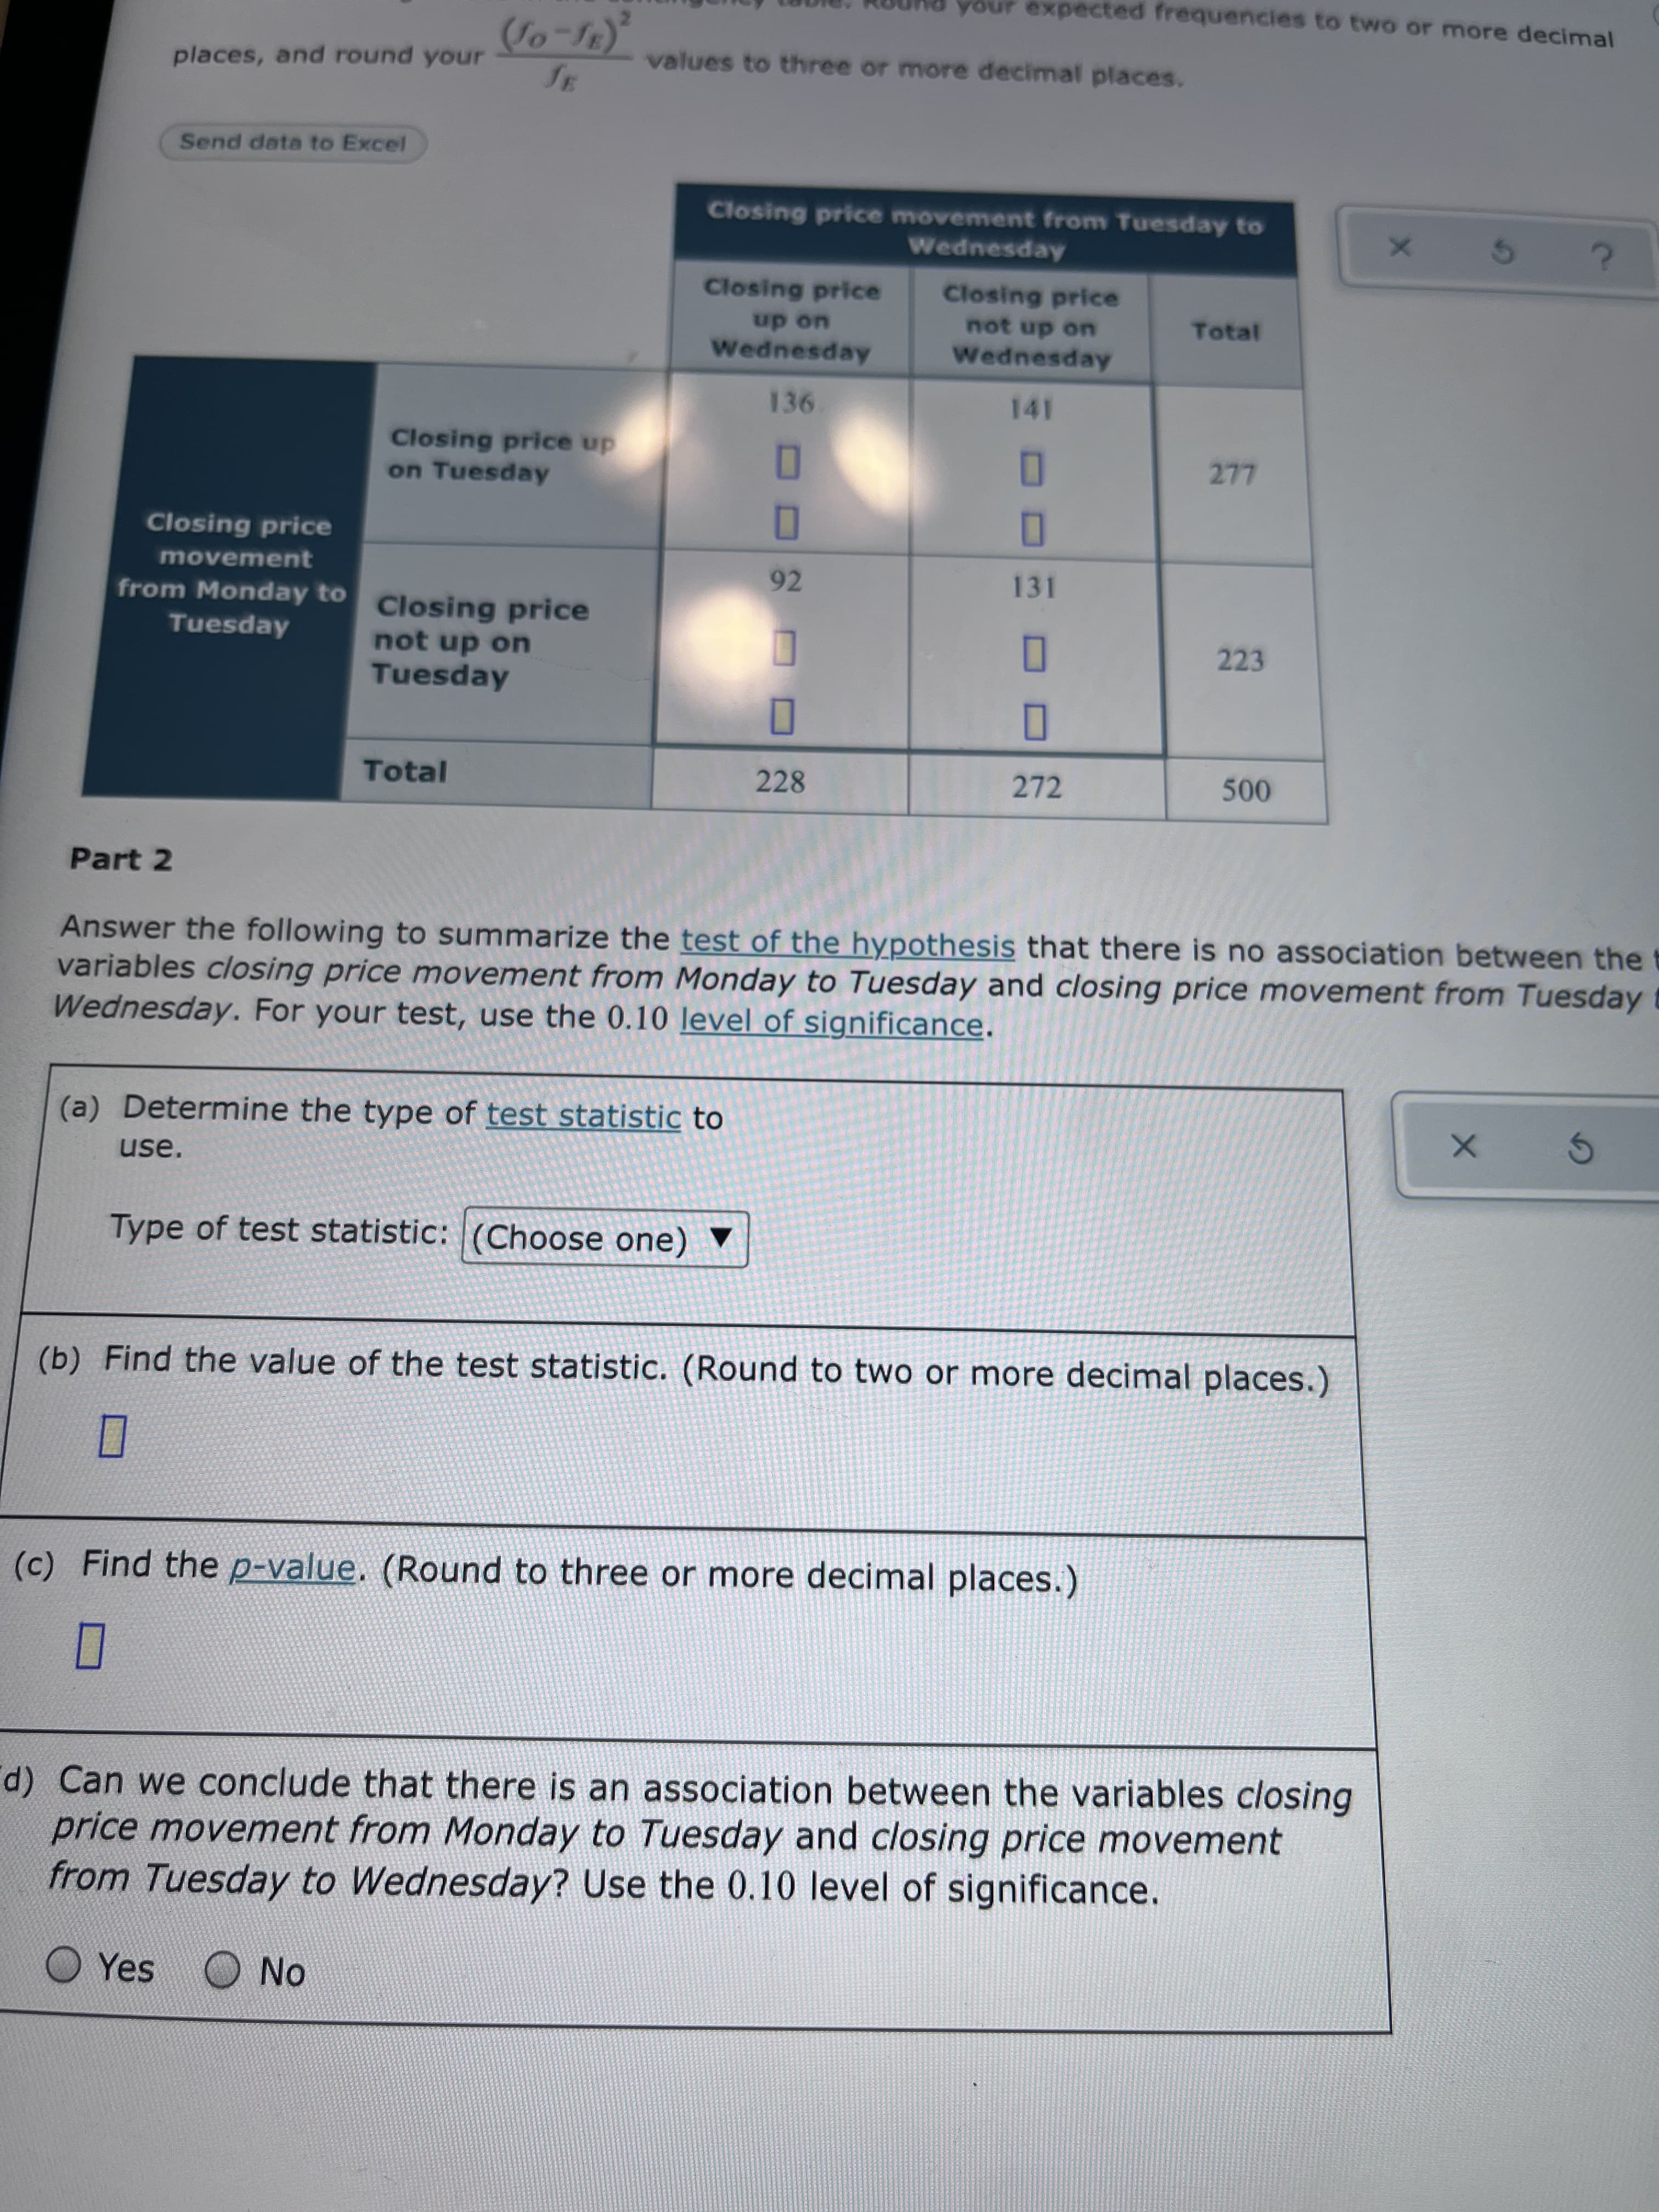
Transcribed Image Text:your expected frequencies to two or more decimal
places, and round your
values to three or more decimal places.
Send data to Excel
Closing price movement from Tuesday to
Wednesday
Closing price
Closing price
Total
uo dn 3ou
uo dn
Wednesday
Wednesday
141
Closing price up
on Tuesday
Closing price
movement
92
131
from Monday to
Tuesday
Closing price
not up on
223
Tuesday
O
O
228
Total
272
Part 2
Answer the following to summarize the test of the hypothesis that there is no association between the t
variables closing price movement from Monday to Tuesday and closing price movement from Tuesday t
Wednesday. For your test, use the 0.10 level of significance.
(a) Determine the type of test statistic to
use.
Type of test statistic: (Choose one) ▼
(b) Find the value of the test statistic. (Round to two or more decimal places.)
(c) Find the p-value. (Round to three or more decimal places.)
d) Can we conclude that there is an association between the variables closing
price movement from Monday to Tuesday and closing price movement
from Tuesday to Wednesday? Use the 0.10 level of significance.
O Yes O No
Expert Solution
This question has been solved!
Explore an expertly crafted, step-by-step solution for a thorough understanding of key concepts.

This is a popular solution!

Trending now
This is a popular solution!

Step by step
Solved in 6 steps with 2 images

Recommended textbooks for you
Glencoe Algebra 1, Student Edition, 9780079039897…
Algebra
ISBN:
9780079039897
Author:
Carter
Publisher:
McGraw Hill

Glencoe Algebra 1, Student Edition, 9780079039897…
Algebra
ISBN:
9780079039897
Author:
Carter
Publisher:
McGraw Hill