When n=64 whales are randomy selected, what would be the mean of the sampling distribution? Hã= 18 4.5 O 2.25 1.125
When n=64 whales are randomy selected, what would be the mean of the sampling distribution? Hã= 18 4.5 O 2.25 1.125

Glencoe Algebra 1, Student Edition, 9780079039897, 0079039898, 2018
18th Edition
ISBN:9780079039897
Author:Carter
Publisher:Carter
Chapter10: Statistics
Section10.1: Measures Of Center
Problem 4GP

Related questions
Question
Please answer the question in the picture below to answer the question in the other picture
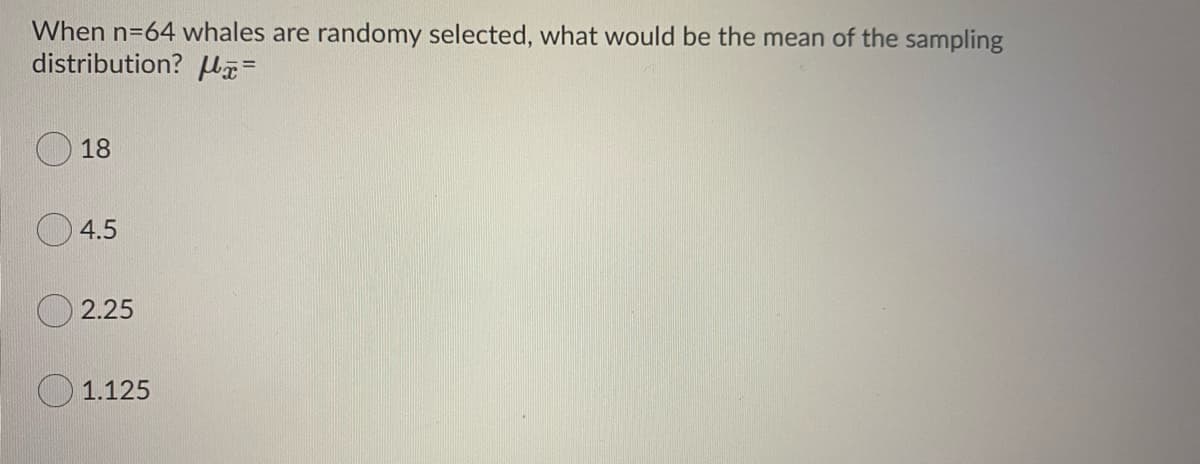
Transcribed Image Text:When n=64 whales are randomy selected, what would be the mean of the sampling
distribution? Hã=
18
O 4.5
O 2.25
1.125
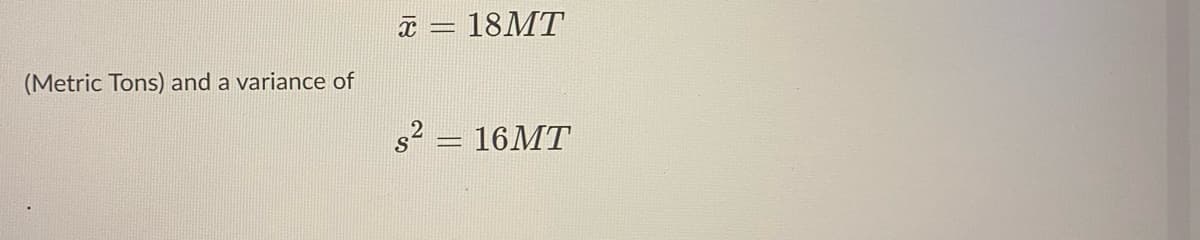
Transcribed Image Text:18MT
(Metric Tons) and a variance of
s2 = 16MT
18
Expert Solution
This question has been solved!
Explore an expertly crafted, step-by-step solution for a thorough understanding of key concepts.

This is a popular solution!

Trending now
This is a popular solution!

Step by step
Solved in 2 steps with 2 images

Recommended textbooks for you
Glencoe Algebra 1, Student Edition, 9780079039897…
Algebra
ISBN:
9780079039897
Author:
Carter
Publisher:
McGraw Hill
Glencoe Algebra 1, Student Edition, 9780079039897…
Algebra
ISBN:
9780079039897
Author:
Carter
Publisher:
McGraw Hill