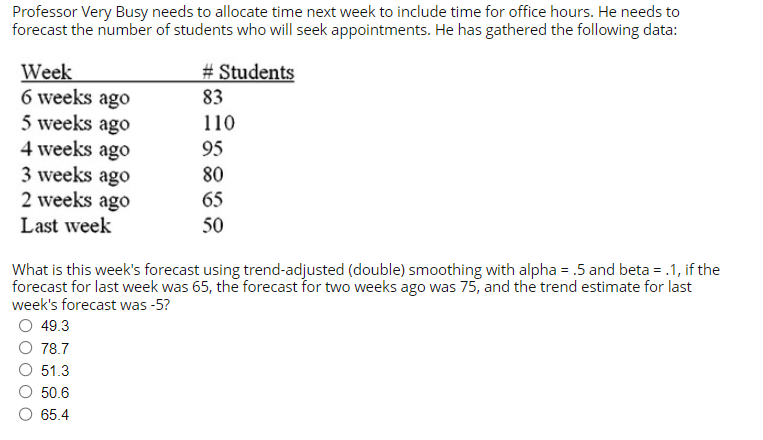
Professor Very Busy needs to allocate time next week to include time for office hours. He needs to forecast the number of students who will seek appointments. He has gathered the following data: Week 6 weeks ago 5 weeks ago 4 weeks ago 3 weeks ago 2 weeks ago Last week # Students 83 110 95 80 65 50


Q: Stanford Rosenberg Computing wants to establish an assembly line for producing a new product, the…
A: Given data is Production goal = 180 PDAs
Q: Amazon Web Services (AWS) is an ERP system.
A: When nearly all significant suppliers have made the decision to aggressively shift to the cloud,…
Q: In Exercises 9-20, use the simplex method to solve the given linear programming problem. (In each…
A: Given LP- Max Z = 3x1+ 4x2+ x3+7x4Subject to-8x1+ 3x2+ 4x3+ x4≤ 72x1+ 6x2+x3+ 5x4≤ 3x1+ 4x2+ 5x3+…
Q: Martha Manufacturing makes three products. Each product requires manufacturing operations in three…
A:
Q: DEFINITION AND CONCEPT OF RECRUITMENT AND SELECTION
A: Famous words used about the recruiting process include recruitment and selection. Finding applicants…
Q: ct throughout its development cycle. Make use of the following sub-headings: describe the factors…
A: Controlling the quality of services is the main focus of quality management, as the name suggests.…
Q: You are the SVP of Operations and when reviewing the assessments of your team one team member writes…
A: A variation in lean six sigma is something that is or might begin to drive the growth of waste (s).…
Q: In a 3 x 3 transportation problem, let xij be the amount shipped from source i to destination j and…
A: Find the Given details below: Given details: 1 2 3 Supply ui 1 C11 C12 C13 15 -2 2 C21…
Q: Explain 'Decision Management' and 'Decision Control' and the 4 elements that make up the…
A: Decision Management refers to coming up with a strategy to make the business more advanced and swift…
Q: The daily holding cost of Alternative 1 is $________. (Enter your response rounded to two decimal…
A: Given, Holding cost = 30% Shipping amount = $104,800 Alternative 1 : Cost = $3370 Days = 30…
Q: A during trip inspections should include checking for:
A: 1. Odometer ReadingsOn practically any pre-trip review structure, on an application etc., the…
Q: You should use a(n) OAX-bar chart OB. R-chart OC. p-chart OD.m-chart OE. v-chart to track the…
A: The issue can only be handled indirectly if the pipe diameter is established for the required…
Q: K Suppose that in month 1, both the retailer and the wholesaler in a supply chain ordered 20,000…
A: Supply chain inefficiencies are caused by the bullwhip effect, another distribution channel…
Q: 9. Office Automation, Inc. has developed a proposal for introducing a new computerized office system…
A: Network diagram: Forward pass: Rules: 1. ES of all initial activities will be zero. 2. ES of…
Q: A manufacturer produces umbrellas. The production rate is 500 per day. The monthly demand for…
A: Economic production quantity is optimal quantity. it is calculated with following formula:- Economic…
Q: The task oriented situational approach to leadership does not involve the organization of resources.…
A: Task-oriented leadership is a directed management approach that specifies tasks and goals.…
Q: You are facing a labor strike. You need to redesign schedules accordingly given the fact some…
A: The shifts are of 6 hours and an employee will need to work for 9 hours. If we split the shifts into…
Q: gainesvile cigar stocks cuban cigars that have variable lead times because of the difficulty in…
A: Given data is Lead time (L) = 6 weeks Lead time standard deviation(sigma L) = 2 weeks Demand(D) =…
Q: Kelly-Lambing, Inc., a builder of government contracted small ships, has a steady work force of 10…
A: Given, First unit takes 6100 hours Learning rate = 75% Learning coefficient b = Log(0.75)/Log(2) =…
Q: When IT project output meet the user’s information requirement, then what can be achieved? Competent…
A: Explanation : At the point when the interaction with the output of the it project is simple then…
Q: University of Florida football programs are printed 1 week prior to each home game. Attendance…
A: Underestimating costs is a common issue in economics. It happens when decision-makers or planners…
Q: amount of time, whi ly relevant and imp. uch a measure. Wha t?
A: Combining the right tools to produce the results is risk identification.
Q: 1. Which of the following forecasting methods is (are) more appropriate for the demand given in this…
A: In the process of forecasting, known data is used to model historical trends across time and make…
Q: a) Based on the activity time estimates, the expected times and variance for each of the…
A: A network diagram related to the project shows the sequence of the task that is performed to…
Q: What is the Late Start on Activity C? What is the slack on Activity C? What is the slack on…
A: A network diagram related to the project is which shows the set sequence of the task that is done to…
Q: Courtney is a programmer receiving requests each week to analyze a large data base. Five jobs were…
A: Given data is
Q: Kris Lee, the owner and manager of the Quality Hardware Store, is reassessing his inventory policy…
A: As per the guideline, the first three parts are answerable plz repost the remaining one. Given data:…
Q: ?Q) Solve the LPP problems below by using big M-Method MIN Z=8X1+2X2 S.T X1+2X2=66 X1+6X2268…
A: Given LLP- Min Z = 8x1 + 2x2Subject to-x1 + 2x2= 66x1 + 6x2≥ 68x1 + 4x2≤82x1,x2≥0
Q: Regarding the economic order quantity, which of the following is true? OA all of the options are…
A: Introduction: EOQ or Economic Order Quantity is a measurement tool to determine the economic order…
Q: ue to a product using either Porter’s or Hines’ model.
A: Michael Porter created the value chain, commonly referred to as Porter's Value Chain Analysis, as a…
Q: At Quick Car Wash, the wash process is advertised to take less than 8 minutes. Consequently,…
A: R-chart is the type of control chart which is used to analysis the process variability. Sample…
Q: Suppose that in month 1, both the retailer and the wholesaler in a supply chain ordered 20,000…
A: Bullwhip effect describes how demand is amplified at all levels of the supply chain. Although the…
Q: 2. Objective function: z = x₁ + 3x₂ Z Constraints: x₁ + x₂ ≤ 4 X1 x₁ - x₂ = 1 X1, X₂0
A: As in the question, only a simplex table is asked, so only that is provided the solution. No further…
Q: iping Manufacturing assembles television sets. The company purchases 3,600 television kits per year,…
A: Given data: Part 1)Annual Demand (D)=3600 kits/yearUnit cost = $65Ordering Cost (S) =$31Holding Cost…
Q: Given a project with the following characteristics, answer the following questions: 1. You are the…
A: Given data: Build 2 birdhouses in =12 months.Each birdhouse is planned to cost= $100.The project…
Q: A small, independent amusement park collects data on the number of cars with out-of-state license…
A: Formulae used: Standard deviation(SP) =P×1-PN Overall proportionP =Total of all defectsTotal of all…
Q: At the Qatar 2022 FIFA World Cup’s opening game on 20 November 2022, the iconic Al Bayt Stadium was…
A: Arrival rate = 3,851 fans per hour Service rate = 819 every 12 minutes = 819×6012=4095 fans per hour…
Q: Make a list of two ways to reduce rework expenses. What role, in your opinion, does gradual delivery…
A: Optimal planning Without a proper and structured plan, it is sure that rework will happen sooner or…
Q: Northcutt manufactures high-end racing bikes and is looking for a source of gear sprocket sets.…
A: Given data is Supplier Price per set Packing cost per set Total inland freight cost International…
Q: A manufacturer of industrial sales has production capacity of 1,000 units per day. Currently, the…
A: Given data is Normal production = 1000 units per day Normal cost = $10×1000=$10000 Spot production =…
Q: Given the following activity network: A1 A2 A3
A: An activity network is a method of showing the relationship between the activities of a project…
Q: Firewire is a high-end manufacturer of surfboards. A surfboard is sourced at a cost of $80 and sold…
A: Unit cost (c) = $80 Selling price (p) = $125 Unsold unit value = $70 Inventory holding cost (H) =…
Q: tangible and intangib duct attributes are imp re important than inta ct attributos are impo
A: A potential buyer might pick what to buy based on the features that characterize the product—both…
Q: find information on major technology project. Then, assign yourself as a project manager for the…
A: The major technology project that I have chosen is development of the new software application for…
Q: What value of Z should be applied? ▼ 1.28? 2.06? 1.04? or 1.65? Part 3 b) How many drives should…
A: Given, Mean m = 50 units Standard deviation s = 5 units Service level = 98%
Q: Educate staff and management of V&A Waterfront on different dynamics in Operations Management, by…
A: Planning, organising, and regulating the resources required to generate a company's goods and…
Q: 4. A company that produces pleasure boats has decided to expand one of its lines. Current facilities…
A: Given: Alternative, A (new location) Fixed cost =$250,000 Variable cost = $500 per boat Alternative…
Q: Your job as the production cost estimator is to prepare the estimate. Refer to Table E.3. Total…
A: Given: Learning rate = 85% Time first unit took = 112 hrs
Q: Activity Research and Development Manufacturing Engineering Quality Engineering Plant Facilities…
A: Prevention costs are mainly used to control or bypass quality-related issues. Prevention costs are…
Q: In the basic EOQ model, if the cost of placing an order doubles, and all other values remain…
A: Let us assume that the initial order cost as "x" Now if we double the order cost it will be "2x" The…
Y9


Trending now
This is a popular solution!

Step by step
Solved in 2 steps

- The Baker Company wants to develop a budget to predict how overhead costs vary with activity levels. Management is trying to decide whether direct labor hours (DLH) or units produced is the better measure of activity for the firm. Monthly data for the preceding 24 months appear in the file P13_40.xlsx. Use regression analysis to determine which measure, DLH or Units (or both), should be used for the budget. How would the regression equation be used to obtain the budget for the firms overhead costs?The file P13_42.xlsx contains monthly data on consumer revolving credit (in millions of dollars) through credit unions. a. Use these data to forecast consumer revolving credit through credit unions for the next 12 months. Do it in two ways. First, fit an exponential trend to the series. Second, use Holts method with optimized smoothing constants. b. Which of these two methods appears to provide the best forecasts? Answer by comparing their MAPE values.The owner of a restaurant in Bloomington, Indiana, has recorded sales data for the past 19 years. He has also recorded data on potentially relevant variables. The data are listed in the file P13_17.xlsx. a. Estimate a simple regression equation involving annual sales (the dependent variable) and the size of the population residing within 10 miles of the restaurant (the explanatory variable). Interpret R-square for this regression. b. Add another explanatory variableannual advertising expendituresto the regression equation in part a. Estimate and interpret this expanded equation. How does the R-square value for this multiple regression equation compare to that of the simple regression equation estimated in part a? Explain any difference between the two R-square values. How can you use the adjusted R-squares for a comparison of the two equations? c. Add one more explanatory variable to the multiple regression equation estimated in part b. In particular, estimate and interpret the coefficients of a multiple regression equation that includes the previous years advertising expenditure. How does the inclusion of this third explanatory variable affect the R-square, compared to the corresponding values for the equation of part b? Explain any changes in this value. What does the adjusted R-square for the new equation tell you?
- The file P13_29.xlsx contains monthly time series data for total U.S. retail sales of building materials (which includes retail sales of building materials, hardware and garden supply stores, and mobile home dealers). a. Is seasonality present in these data? If so, characterize the seasonality pattern. b. Use Winters method to forecast this series with smoothing constants = = 0.1 and = 0.3. Does the forecast series seem to track the seasonal pattern well? What are your forecasts for the next 12 months?The file P13_22.xlsx contains total monthly U.S. retail sales data. While holding out the final six months of observations for validation purposes, use the method of moving averages with a carefully chosen span to forecast U.S. retail sales in the next year. Comment on the performance of your model. What makes this time series more challenging to forecast?Under what conditions might a firm use multiple forecasting methods?
- The file P13_02.xlsx contains five years of monthly data on sales (number of units sold) for a particular company. The company suspects that except for random noise, its sales are growing by a constant percentage each month and will continue to do so for at least the near future. a. Explain briefly whether the plot of the series visually supports the companys suspicion. b. By what percentage are sales increasing each month? c. What is the MAPE for the forecast model in part b? In words, what does it measure? Considering its magnitude, does the model seem to be doing a good job? d. In words, how does the model make forecasts for future months? Specifically, given the forecast value for the last month in the data set, what simple arithmetic could you use to obtain forecasts for the next few months?The file P13_28.xlsx contains monthly retail sales of U.S. liquor stores. a. Is seasonality present in these data? If so, characterize the seasonality pattern. b. Use Winters method to forecast this series with smoothing constants = = 0.1 and = 0.3. Does the forecast series seem to track the seasonal pattern well? What are your forecasts for the next 12 months?The file P13_26.xlsx contains the monthly number of airline tickets sold by the CareFree Travel Agency. a. Create a time series chart of the data. Based on what you see, which of the exponential smoothing models do you think will provide the best forecasting model? Why? b. Use simple exponential smoothing to forecast these data, using a smoothing constant of 0.1. c. Repeat part b, but search for the smoothing constant that makes RMSE as small as possible. Does it make much of an improvement over the model in part b?
- A small computer chip manufacturer wants to forecast monthly ozperating costs as a function of the number of units produced during a month. The company has collected the 16 months of data in the file P13_34.xlsx. a. Determine an equation that can be used to predict monthly production costs from units produced. Are there any outliers? b. How could the regression line obtained in part a be used to determine whether the company was efficient or inefficient during any particular month?Suppose that a regional express delivery service company wants to estimate the cost of shipping a package (Y) as a function of cargo type, where cargo type includes the following possibilities: fragile, semifragile, and durable. Costs for 15 randomly chosen packages of approximately the same weight and same distance shipped, but of different cargo types, are provided in the file P13_16.xlsx. a. Estimate a regression equation using the given sample data, and interpret the estimated regression coefficients. b. According to the estimated regression equation, which cargo type is the most costly to ship? Which cargo type is the least costly to ship? c. How well does the estimated equation fit the given sample data? How might the fit be improved? d. Given the estimated regression equation, predict the cost of shipping a package with semifragile cargo.The file P13_25.xlsx contains the quarterly numbers of applications for home mortgage loans at a branch office of Northern Central Bank. a. Create a time series chart of the data. Based on what you see, which of the exponential smoothing models do you think will provide the best forecasting model? Why? b. Use simple exponential smoothing to forecast these data, using a smoothing constant of 0.1. c. Repeat part b, but search for the smoothing constant that makes RMSE as small as possible. Does it make much of an improvement over the model in part b? Is it guaranteed to produce better forecasts for the future?

