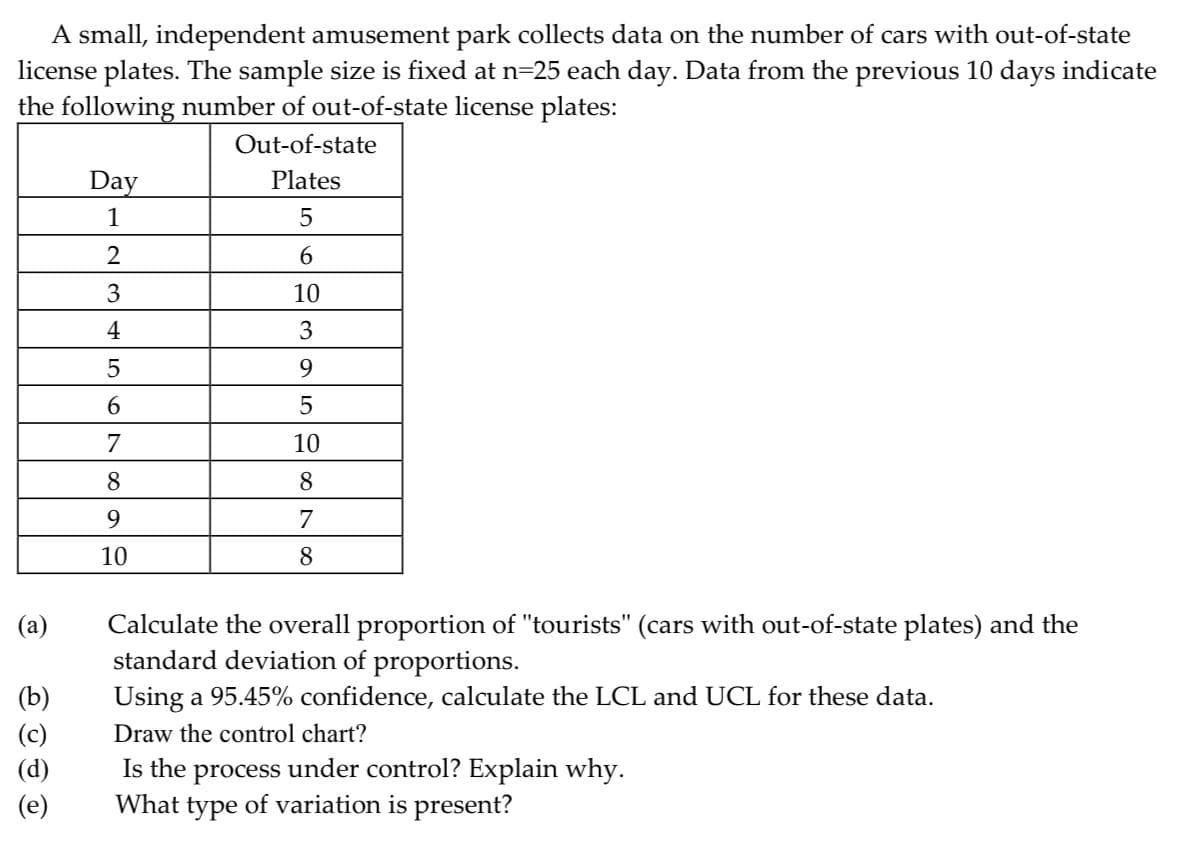
A small, independent amusement park collects data on the number of cars with out-of-state license plates. The sample size is fixed at n=25 each day. Data from the previous 10 days indicate the following number of out-of-state license plates: Out-of-state Plates 5 6 10 3 9 5 10 8 7 8 (a) (b) (c) (d) (e) Day 1 2 3 4 اه اما 5 6 7 8 9 10 Calculate the overall proportion of "tourists" (cars with out-of-state plates) and the standard deviation of proportions. Using a 95.45% confidence, calculate the LCL and UCL for these data. Draw the control chart? Is the process under control? Explain why. What type of variation is present?
A small, independent amusement park collects data on the number of cars with out-of-state license plates. The sample size is fixed at n=25 each day. Data from the previous 10 days indicate the following number of out-of-state license plates: Out-of-state Plates 5 6 10 3 9 5 10 8 7 8 (a) (b) (c) (d) (e) Day 1 2 3 4 اه اما 5 6 7 8 9 10 Calculate the overall proportion of "tourists" (cars with out-of-state plates) and the standard deviation of proportions. Using a 95.45% confidence, calculate the LCL and UCL for these data. Draw the control chart? Is the process under control? Explain why. What type of variation is present?

Practical Management Science
6th Edition
ISBN:9781337406659
Author:WINSTON, Wayne L.
Publisher:WINSTON, Wayne L.
Chapter2: Introduction To Spreadsheet Modeling
Section: Chapter Questions
Problem 20P: Julie James is opening a lemonade stand. She believes the fixed cost per week of running the stand...

Related questions
Question
kindly solve accurate and exact with correct formuas thanks..with complete steps
Transcribed Image Text:A small, independent amusement park collects data on the number of cars with out-of-state
license plates. The sample size is fixed at n=25 each day. Data from the previous 10 days indicate
the following number of out-of-state license plates:
Out-of-state
Plates
5
6
10
3
9
5
10
8
7
8
(a)
(b)
(c)
(d)
(e)
Day
1
2
3
4
5
6
7
8
9
10
Calculate the overall proportion of "tourists" (cars with out-of-state plates) and the
standard deviation of proportions.
Using a 95.45% confidence, calculate the LCL and UCL for these data.
Draw the control chart?
Is the process under control? Explain why.
What type of variation is present?
Expert Solution
This question has been solved!
Explore an expertly crafted, step-by-step solution for a thorough understanding of key concepts.

This is a popular solution!

Trending now
This is a popular solution!

Step by step
Solved in 2 steps with 2 images

Recommended textbooks for you
Practical Management Science
Operations Management
ISBN:
9781337406659
Author:
WINSTON, Wayne L.
Publisher:
Cengage,

Operations Management
Operations Management
ISBN:
9781259667473
Author:
William J Stevenson
Publisher:
McGraw-Hill Education

Operations and Supply Chain Management (Mcgraw-hi…
Operations Management
ISBN:
9781259666100
Author:
F. Robert Jacobs, Richard B Chase
Publisher:
McGraw-Hill Education
Practical Management Science
Operations Management
ISBN:
9781337406659
Author:
WINSTON, Wayne L.
Publisher:
Cengage,
Operations Management
Operations Management
ISBN:
9781259667473
Author:
William J Stevenson
Publisher:
McGraw-Hill Education
Operations and Supply Chain Management (Mcgraw-hi…
Operations Management
ISBN:
9781259666100
Author:
F. Robert Jacobs, Richard B Chase
Publisher:
McGraw-Hill Education


Purchasing and Supply Chain Management
Operations Management
ISBN:
9781285869681
Author:
Robert M. Monczka, Robert B. Handfield, Larry C. Giunipero, James L. Patterson
Publisher:
Cengage Learning

Production and Operations Analysis, Seventh Editi…
Operations Management
ISBN:
9781478623069
Author:
Steven Nahmias, Tava Lennon Olsen
Publisher:
Waveland Press, Inc.