Profitability Ratios: 1. Following is the profit and loss account of a limited company 10,000 Sales 50,000 Closing Stock 50,000 110,000 Opening Stock Purchases 90,000 20,000 Gross profit c/d 110,000 Gross profit b/d Administration Expenses Selling and Distribution Expenses 50,000 6,000 4,000 Net Profit 40,000 50,000 50,000 Calculate: Gross profit ratio, Net profit ratio 2. From the following data, calculate (a) Gross profit ratio (b) Net profit ratio. RO 200,000 RO 300,000 RO 60,000 Sales Cost of sales Net profit Sales Returns RO 20,000 3. From the following data, calculate (a) Gross profit ratio (b) Net profit ratio. Sales RO 25,000 RO 320,000 RO 70,000 Sales returns Opening stock Closing stock RO 25,000
Profitability Ratios: 1. Following is the profit and loss account of a limited company 10,000 Sales 50,000 Closing Stock 50,000 110,000 Opening Stock Purchases 90,000 20,000 Gross profit c/d 110,000 Gross profit b/d Administration Expenses Selling and Distribution Expenses 50,000 6,000 4,000 Net Profit 40,000 50,000 50,000 Calculate: Gross profit ratio, Net profit ratio 2. From the following data, calculate (a) Gross profit ratio (b) Net profit ratio. RO 200,000 RO 300,000 RO 60,000 Sales Cost of sales Net profit Sales Returns RO 20,000 3. From the following data, calculate (a) Gross profit ratio (b) Net profit ratio. Sales RO 25,000 RO 320,000 RO 70,000 Sales returns Opening stock Closing stock RO 25,000

Century 21 Accounting General Journal
11th Edition
ISBN:9781337680059
Author:Gilbertson
Publisher:Gilbertson
Chapter17: Financial Statement Analysis
Section: Chapter Questions
Problem 4AP

Related questions
Question
Transcribed Image Text:Enable Editing
location and might be unsafe. Click for more details.
3.
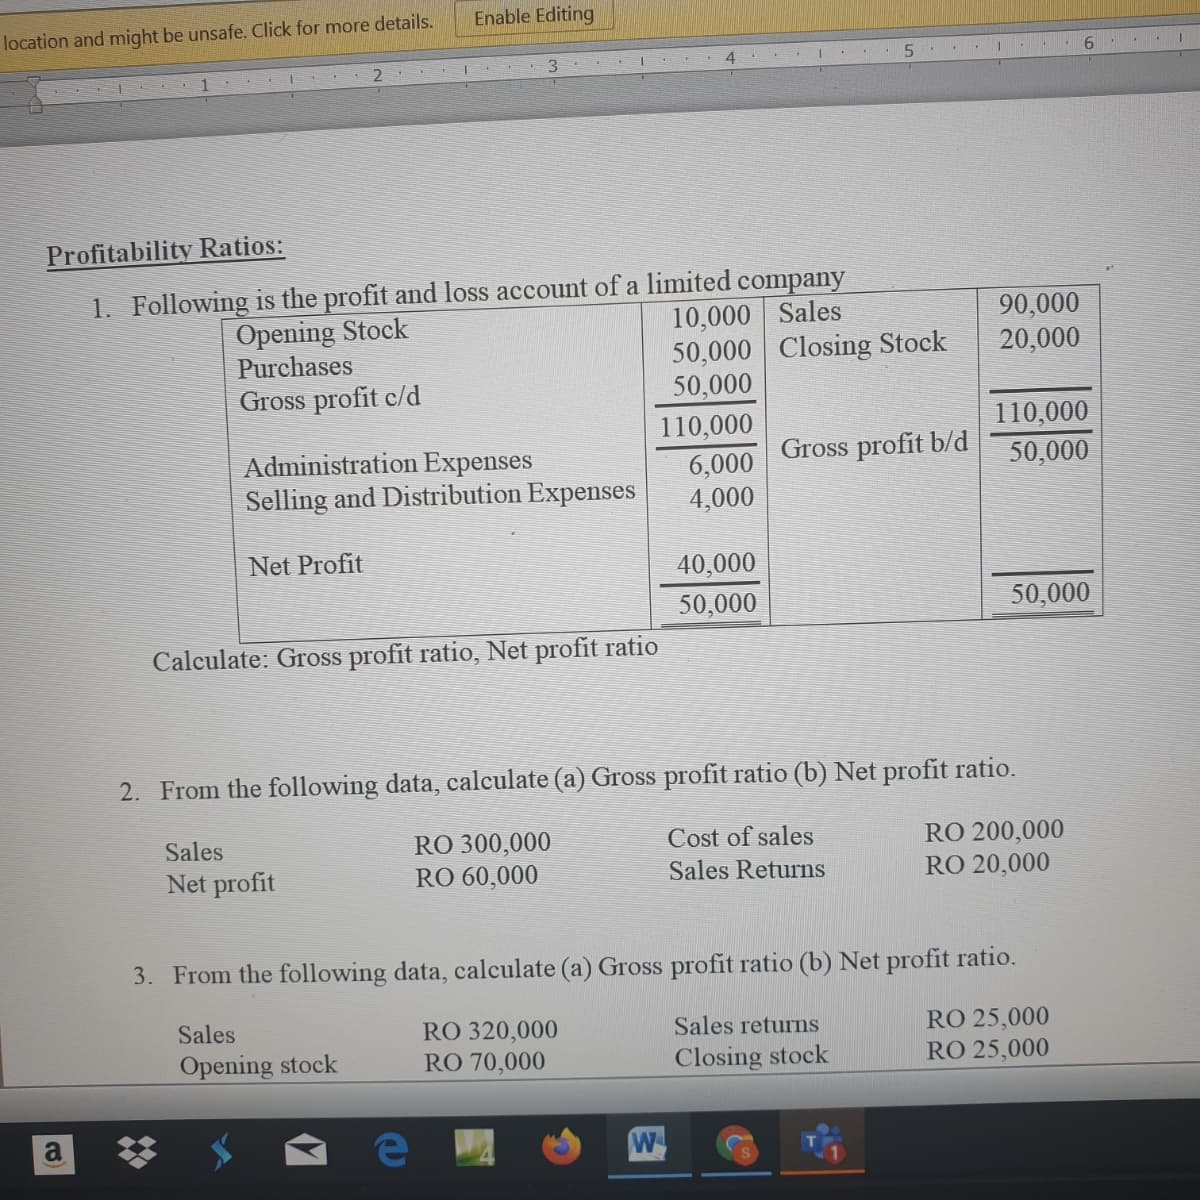
Profitability Ratios:
1. Following is the profit and loss account of a limited company
Opening Stock
Purchases
10,000 Sales
50,000 Closing Stock
50,000
90,000
20,000
Gross profit c/d
110,000
110,000
Gross profit b/d
Administration Expenses
Selling and Distribution Expenses
50,000
6,000
4,000
Net Profit
40,000
50,000
50,000
Calculate: Gross profit ratio, Net profit ratio
2. From the following data, calculate (a) Gross profit ratio (b) Net profit ratio.
RO 300,000
RO 200,000
RO 20,000
Sales
Cost of sales
Net profit
RO 60,000
Sales Returns
3. From the following data, calculate (a) Gross profit ratio (b) Net profit ratio.
Sales
RO 320,000
RO 70,000
RO 25,000
RO 25,000
Sales returns
Opening stock
Closing stock
Expert Solution
This question has been solved!
Explore an expertly crafted, step-by-step solution for a thorough understanding of key concepts.

Step by step
Solved in 3 steps with 2 images

Knowledge Booster


Learn more about
Need a deep-dive on the concept behind this application? Look no further. Learn more about this topic, finance and related others by exploring similar questions and additional content below.Recommended textbooks for you

Survey of Accounting (Accounting I)
Accounting
ISBN:
9781305961883
Author:
Carl Warren
Publisher:
Cengage Learning
Survey of Accounting (Accounting I)
Accounting
ISBN:
9781305961883
Author:
Carl Warren
Publisher:
Cengage Learning
Principles of Accounting Volume 1
Accounting
ISBN:
9781947172685
Author:
OpenStax
Publisher:
OpenStax College