Provide an appropriate response. 5) Find the area of the shaded region. The graph depicts IQ scores of adults, and those scores 5) are normally distributed with a mean of 100 and a standard deviation of 15 (as on the Wechsler test). 60 65 70 75 80 85 90 95 100 105 110 115 120 125 130 135 140
Provide an appropriate response. 5) Find the area of the shaded region. The graph depicts IQ scores of adults, and those scores 5) are normally distributed with a mean of 100 and a standard deviation of 15 (as on the Wechsler test). 60 65 70 75 80 85 90 95 100 105 110 115 120 125 130 135 140

Glencoe Algebra 1, Student Edition, 9780079039897, 0079039898, 2018
18th Edition
ISBN:9780079039897
Author:Carter
Publisher:Carter
Chapter10: Statistics
Section10.4: Distributions Of Data
Problem 19PFA

Related questions
Question
Transcribed Image Text:Provide an appropriate response.
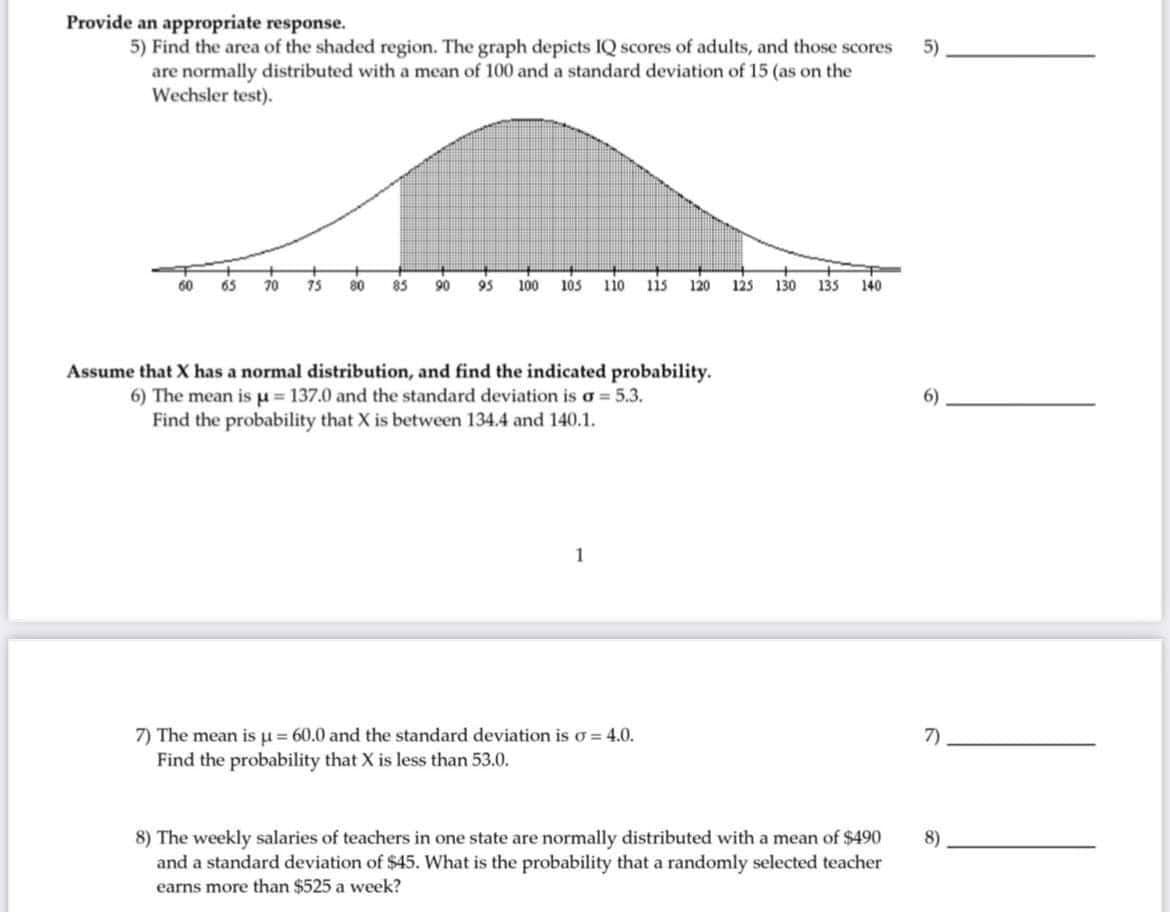
5) Find the area of the shaded region. The graph depicts IQ scores of adults, and those scores
5)
are normally distributed with a mean of 100 and a standard deviation of 15 (as on the
Wechsler test).
60 65 70 75 80 85 90 95 100 105 110 115 120 125 130 135 140
Assume that X has a normal distribution, and find the indicated probability.
6) The mean is µ = 137.0 and the standard deviation is a = 5.3.
Find the probability that X is between 134.4 and 140.1.
6)
1
7)
7) The mean is µ = 60.0 and the standard deviation is o = 4.0.
Find the probability that X is less than 53.0.
8)
8) The weekly salaries of teachers in one state are normally distributed with a mean of $490
and a standard deviation of $45. What is the probability that a randomly selected teacher
earns more than $525 a week?
Expert Solution
This question has been solved!
Explore an expertly crafted, step-by-step solution for a thorough understanding of key concepts.

This is a popular solution!

Trending now
This is a popular solution!

Step by step
Solved in 2 steps

Recommended textbooks for you
Glencoe Algebra 1, Student Edition, 9780079039897…
Algebra
ISBN:
9780079039897
Author:
Carter
Publisher:
McGraw Hill
Glencoe Algebra 1, Student Edition, 9780079039897…
Algebra
ISBN:
9780079039897
Author:
Carter
Publisher:
McGraw Hill