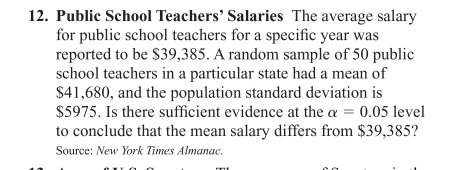
Public School Teachers' Salaries The average salary for public school teachers for a specific year was reported to be $39,385. A random sample of 50 public school teachers in a particular state had a mean of $41,680, and the population standard deviation is $5975. Is there sufficient evidence at the a = 0.05 level to conclude that the mean salary differs from $39,385?
Public School Teachers' Salaries The average salary for public school teachers for a specific year was reported to be $39,385. A random sample of 50 public school teachers in a particular state had a mean of $41,680, and the population standard deviation is $5975. Is there sufficient evidence at the a = 0.05 level to conclude that the mean salary differs from $39,385?

MATLAB: An Introduction with Applications
6th Edition
ISBN:9781119256830
Author:Amos Gilat
Publisher:Amos Gilat
Chapter1: Starting With Matlab
Section: Chapter Questions
Problem 1P

Related questions
Topic Video
Question
100%
This is about Z test for a
Transcribed Image Text:12. Public School Teachers' Salaries The average salary
for public school teachers for a specific year was
reported to be $39,385. A random sample of 50 public
school teachers in a particular state had a mean of
$41,680, and the population standard deviation is
$5975. Is there sufficient evidence at the a = 0.05 level
to conclude that the mean salary differs from $39,385?
Source: New York Times Almanac.
Transcribed Image Text:State the hypotheses and identify the claim.
b. Find the critical value(s).
c. Compute the test value.
d. Make the decision.
a.
Summarize the results.
Use diagrams to show the critical region (or regions),
and use the traditional method of hypothesis testing
unless otherwise specified.
Expert Solution
This question has been solved!
Explore an expertly crafted, step-by-step solution for a thorough understanding of key concepts.

This is a popular solution!

Trending now
This is a popular solution!

Step by step
Solved in 3 steps with 1 images

Knowledge Booster


Learn more about
Need a deep-dive on the concept behind this application? Look no further. Learn more about this topic, statistics and related others by exploring similar questions and additional content below.Recommended textbooks for you
MATLAB: An Introduction with Applications
Statistics
ISBN:
9781119256830
Author:
Amos Gilat
Publisher:
John Wiley & Sons Inc

Probability and Statistics for Engineering and th…
Statistics
ISBN:
9781305251809
Author:
Jay L. Devore
Publisher:
Cengage Learning

Statistics for The Behavioral Sciences (MindTap C…
Statistics
ISBN:
9781305504912
Author:
Frederick J Gravetter, Larry B. Wallnau
Publisher:
Cengage Learning
MATLAB: An Introduction with Applications
Statistics
ISBN:
9781119256830
Author:
Amos Gilat
Publisher:
John Wiley & Sons Inc
Probability and Statistics for Engineering and th…
Statistics
ISBN:
9781305251809
Author:
Jay L. Devore
Publisher:
Cengage Learning
Statistics for The Behavioral Sciences (MindTap C…
Statistics
ISBN:
9781305504912
Author:
Frederick J Gravetter, Larry B. Wallnau
Publisher:
Cengage Learning

Elementary Statistics: Picturing the World (7th E…
Statistics
ISBN:
9780134683416
Author:
Ron Larson, Betsy Farber
Publisher:
PEARSON

The Basic Practice of Statistics
Statistics
ISBN:
9781319042578
Author:
David S. Moore, William I. Notz, Michael A. Fligner
Publisher:
W. H. Freeman

Introduction to the Practice of Statistics
Statistics
ISBN:
9781319013387
Author:
David S. Moore, George P. McCabe, Bruce A. Craig
Publisher:
W. H. Freeman