Q 1. interest y. Consider the following bivariate data of an independent variable x and dependent variable of X y 1 1 2 3 4 6 0 0 3 2 1 0 0 -1 -2 -15 (a) Calculate the mean, sample variance and sample standard deviations for x and y. Hint: Recall the formula for sample variance of x 8²=1-1 (₁-2)²2 (Σ1 ) – }(Σ.)2 n-1 n-1 = (b) State the Chebyshev's and empirical rule for the proportion of samples that approximately lie within two standard deviations of the mean for the variable y. Clearly state the intervals and any assumptions. (c) The sample correlation coefficient is given by Σ(₁-7)(y- ÿ) νΣ. (π. - 7) Σ" 1(: - g)2 Calculate r and comment on the relationship between x and y.
Q 1. interest y. Consider the following bivariate data of an independent variable x and dependent variable of X y 1 1 2 3 4 6 0 0 3 2 1 0 0 -1 -2 -15 (a) Calculate the mean, sample variance and sample standard deviations for x and y. Hint: Recall the formula for sample variance of x 8²=1-1 (₁-2)²2 (Σ1 ) – }(Σ.)2 n-1 n-1 = (b) State the Chebyshev's and empirical rule for the proportion of samples that approximately lie within two standard deviations of the mean for the variable y. Clearly state the intervals and any assumptions. (c) The sample correlation coefficient is given by Σ(₁-7)(y- ÿ) νΣ. (π. - 7) Σ" 1(: - g)2 Calculate r and comment on the relationship between x and y.

MATLAB: An Introduction with Applications
6th Edition
ISBN:9781119256830
Author:Amos Gilat
Publisher:Amos Gilat
Chapter1: Starting With Matlab
Section: Chapter Questions
Problem 1P

Related questions
Question
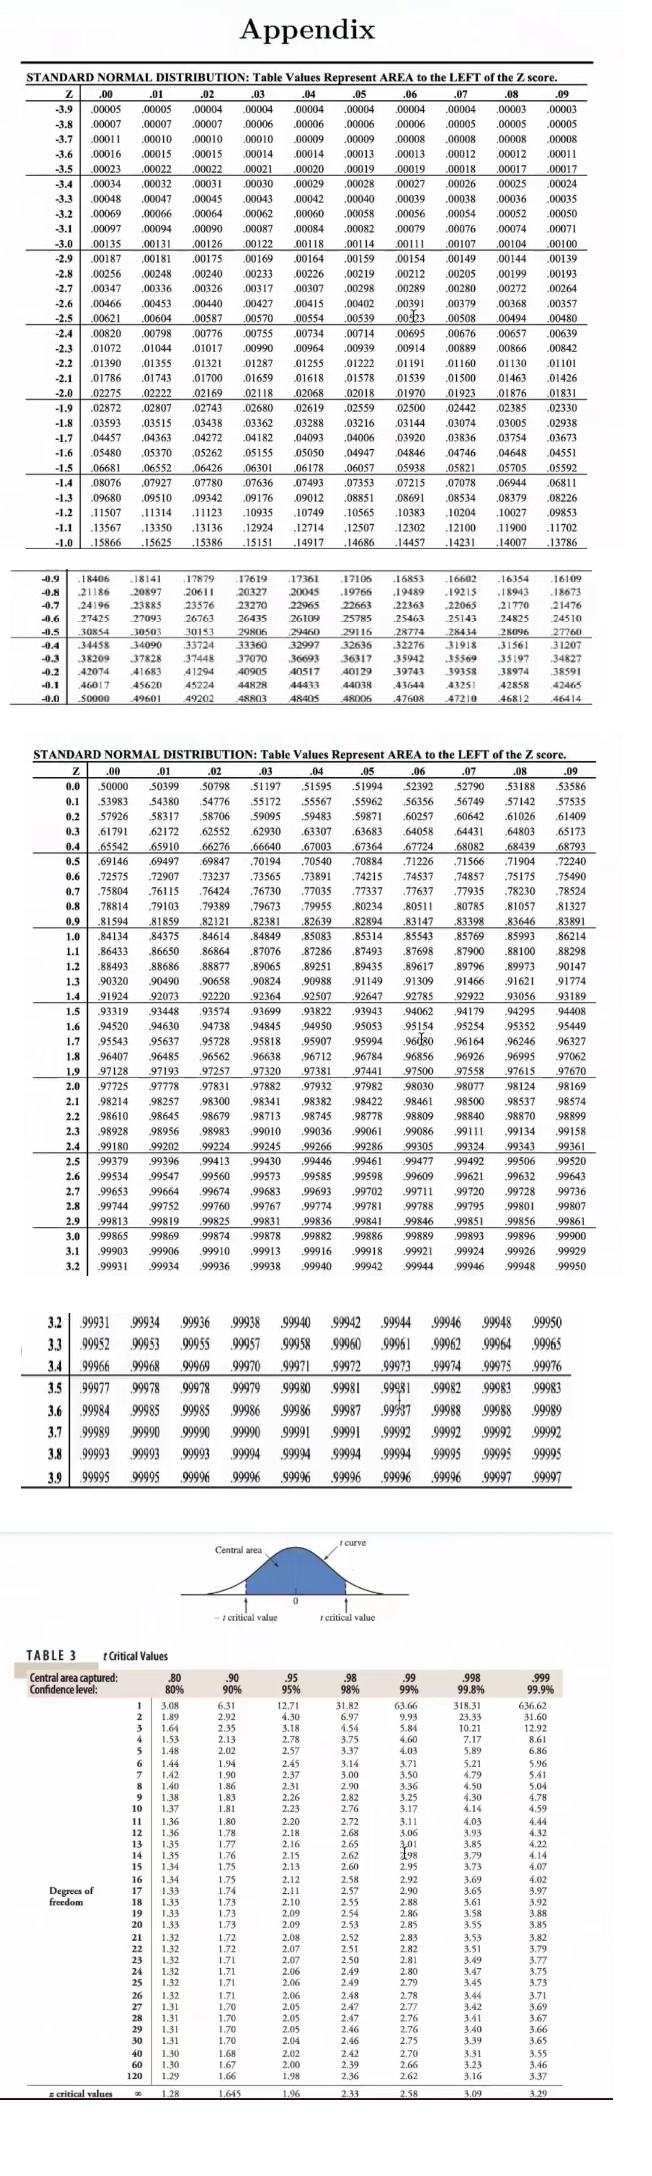
Transcribed Image Text:STANDARD NORMAL DISTRIBUTION: Table Values Represent AREA to the LEFT of the Z score.
Z
.00
.01
.04
.05
.06
.07
.08
.09
.02
.03
.00004 .00004
00004
00004 .00003 .00003
-3.9 .00005 00005
-3.8 00007 .00007
.00007
.00006
.00006
.00005
.00004 .00004
00006 .00006 .00005 .00005
00008
.00012 .00012 .00011
-3.7 .00011
.00010
.00010
.00008
-3.6 .00016
.00015
.00015
.00010 .00009 .00009 00008 .00008
.00014 00014 .00013 .00013
.00020 .00019
.00029 .00028
00023
.00022
.00022
00021
.00019
00018
00017
.00017
-3.5
-3.4 .00034
.00032
.00031 .00030
.00027
.00026
.00025
-3.3 .00048
.00047
.00045 .00043
.00042 .00040
00039
.00038
.00036
-3.2 .00069
.00066
.00064
.00062
.00060
.00058
.00056
.00054 .00052
-3.1 .00097 ,00094
.00090
00084
.00082 .00079
.00076
.00074
-3.0 .00135 .00131 .00126
00118 ,00114
00111
.00107
.00104
-2.9 .00187 .00181
.00175
.00164
.00159 00154
.00149 .00144
00199
-2.8 .00256 .00248
.00240
.00226
.00205
-2.7 .00347 .00336 .00326
00307
.00280 .00272
00427
00415
.00379 .00368
-2.6 00466 00453 .00440
-2.5 .00621 .00604 .00587 .00570
00554
.00508 00494
.00714
.00695 .00676 .00657
-2.4
-2.3
-2.2 01390 .01355
.00939
00820 00798 .00776 .00755 .00734
01072 .01044 .01017 .00990 00964
.01321 01287 01255
.01700
01618
.00914
.01191
.01222
.01659
.01578 01539
.02018 01970
.02559 02500
.03216 03144
.04006 .03920
04947
04846
-2.1 01786 01743
-2.0 02275 02222 02169 02118
02068
-1.9 .02872 .02807 .02743 .02680 .02619
-1.8 .03593 03515 .03438 .03362 03288
-1.7 04457 04363
.04272 04182 .04093
-1.6 05480 05370 .05262 05155 05050
-1.5 .06681 06552 .06426 .06301 06178
-1.4 08076 07927 .07780 .07636
-1.3 .09680 .09510 .09342 09176
-1.2 11507 .11314 11123 .10935
-1.1 .13567 .13350 ,13136
-1.0 .15866 .15625 15386
.07493
TABLE 3 t Critical Values
Central area captured:
Confidence level:
Degrees of
freedom
-0.9 -18406 18141 17879 17619 .17361
-0.8 21186 20897 20611 20327
-0.7 .24196 23885 23576 23270
-0.6 27425 27093 26763 26435
-0.5 30854 30503 30153
-0.4 34458
-0.3 38209
-0.2 42074
29806
34090
33360
37070
37828
41683 41294 40905
-0.1 46017
45224
44828
45620
-0.0 50000 49601 49202 48803
z critical values
1
3.08
2 1.89
1.64
3
4 1.53
5 1.48
6 1.44
7 1.42
8 1.40
9 1.38
10 1.37
11 1.36
12 1.36
13 1.35
14 1.35
15 1.34
16 1.34
17 1.33
18 1.33
19 1.33
20 1.33
21 1.32
22 1.32
1.32
24 1.32
1.32
| 2008693跟出跟出台!
25
.80
80%
27
33724
37448
40
1.32
1.31
1.31
1.31
1.31
1.30
1.30
1.29
1.28
.90
90%
6.31
2.92
Central area
2.35
2.13
2.02
Appendix
- critical value
1.94
1.90
1.86
1.83
1.81
1.80
1.78
1.77
1.76
1.75
1.75
1.74
1.73
1.73
1.73
.00087
00122
1.72
1.72
1.71
.00169
.00233
00317
STANDARD NORMAL DISTRIBUTION: Table Values Represent AREA to the LEFT of the Z score.
Z
.00
.01
.02
.03
.04
.05
.06
.07
.08
.53188
56749 .57142 57535
.60642 .61026 .61409
.64431 .64803 .65173
.68082 .68439 .68793
.72240
.75490
.78524
.92647 92785
94408
0.0 .50000 50399 .50798 .51197 .51595 .51994 52392 .52790
0.1 .53983 54380 54776 55172 55567 55962 56356
0.2 .57926 58317 58706 59095 59483 59871 .60257
0.3 .61791 .62172 .62552 .62930 .63307 .63683 .64058
0.4 65542 .65910 .66276 .66640 .67003 .67364 .67724
0.5 .69146 .69497 .69847 .70194 .70540 .70884 71226 .71566 .71904
0.6 .72575 .72907 73237 73565 .73891 .74215 .74537 74857 .75175
0.7 .75804 .76115 76424 .76730 .77035 .77337 .77637 .77935 78230
0.8 .78814 .79103 .79389 .79673 .79955 .80234 80511 .80785 .81057 .81327
0.9 .81594 .81859 .82121 .82381 .82639 .82894 .83147 .83398 .83646 .83891
1.0 .84134 .84375
.84614 .84849 .85083 .85314 .85543 .85769 .85993 .86214
1.1 .86433 86650 .86864 .87076 .87286 .87493 .87698 .87900 .88100 .88298
1.2 .88493 .88686 .88877 .89065 .89251 .89435 .89617 .89796 .89973 90147
1.3 .90320 90490 .90658 .90824 .90988 .91149 .91309 .91466 91621 91774
1.4 91924 .92073 92220 92364 .92507
.92922 93056 93189
1.5 .93319 93448
93574
.93699 93822 .93943 94062 94179 .94295
1.6 .94520 94630 .94738 .94845 94950 .95053 95154 .95254 .95352
1.7 .95543 95637 .95728 .95818 .95907 .95994 96080 .96164 .96246
1.8 .96407 96485 .96562 .96638 96712 .96784 .96856
97062
1.9 .97128 97193 97257 .97320 97381 97441 97500 97558 .97615 97670
2.0 .97725 97778 97831 97882 97932
.97982 98030 .98077 .98124 98169
2.1 98214 98257 .98300 .98341 98382 .98422 .98461 .98500 .98537 98574
2.2 .98610 .98645 98679 98713 .98745 .98778 98809 .98840 98870 98899
2.3 .98928 98956 98983 99010 99036 .99061 .99086 99111 .99134 99158
2.4
.99180 99202 99224 99245 99266 99286 99305 99324 99343 .99361
2.5 .99379 .99396 99413 .99430 99446 .99461 99477 99492 99506 .99520
2.6 .99534 .99547 99560 .99573 .99585 .99598 .99609 .99621 99632 99643
2.7 .99653 .99664 99674 .99683 99693 .99702
99711 .99720 .99728 99736
2.8 .99744 99752 99760 .99767 99774 .99781 99788 .99795 .99801 99807
2.9 .99813 99819 99825 .99831 99836 .99841 99846 .99851 99856 99861
3.0 .99865 99869 99874 .99878 .99882 .99886 99889 99893 .99896 99900
3.1 .99903 .99906 99910 .99913 .99916 .99918 .99921 99924 .99926 .99929
3.2 .99931 99934 99936 99938 99940 .99942 .99944 .99946 .99948 99950
95449
96327
.96926 .96995
1.71
1.71
.12924
15151
1.71
1.70
99944 99946 99948 .99950
99961 99962 99964 99965
99960
3.2 99931 99934 99936 99938 99940 99942
3.3 99952 99953 99955 99957 99958
99969 99970 99971 99972
99978 99979 99980 99981
99973 .99974 99975 99976
3.4 99966 99968
3.5 99977 99978
99981 .99982 .99983 99983
3.6 99984 99985
99985 99986 99986 99987
99937 99988 99988 99989
3.7 99989 99990
99990 99990 99991 99991 99992 .99992 99992 99992
3.8 99993 99993
99994 99995 99995 99995
3.9 99995 99995 99996 99996 99996 99996 99996 .99996 99997 99997
99993 99994 99994 99994
1.70
1.70
1.70
1.68
1.67
1.66
1.645
09012
.10749
.12714
14917
22965
26109
17106
20045 .19766
44433
48405
22663
25785
29460
29116
32997
32636
36693 36317
40517
40129
0
.95
95%
12.71
4.30
3.18
2.78
2.57
2.45
2.37
2.31
2.26
2.23
2.20
2.18
2.16
2.15
2.13
2.12
2.11
2.10
2.09
2.09
2.08
2.07
2.07
.00219 .00212
.00298 .00289
.00402
.00539
2.06
2.06
.06057
.07353
.08851
10565
12507
.14686
2.06
2.05
2.05
2.05
2.04
2.02
2.00
1.98
1.96
44038
48006
t curve
I critical value
.98
98%
31.82
6.97
4.54
3.75
3.37
3.14
3.00
2.90
2.82
2.76
2.72
2.68
2.65
2.62
2.60
2.58
2.57
2.55
2.54
2.53
2.52
2.51
00024
.00035
.00050
.00071
00100
.00139
.00193
.00264
.00357
.00480
.00639
.00889 .00866 00842
01101
.01160 .01130
.01426
.01500 01463
01923 01876
.01831
02442 .02385
.02330
.03074
.03005
.02938
.03836 .03754
.03673
.04746 .04648
04551
05938
.05821 .05705
05592
07215
.07078 06944 .06811
08691
08534 08379
10383 .10204 .10027
2.50
2.49
2.49
2.48
2.47
2.47
00391
00523
2.46
2.46
2.42
2.39
2.36
2.33
.12302
.14457 .14231
.16853
16602
19489 .19215
.22363
22065
25463
25143
28774
28434
32276
31918
.35942 .35569
39743
39358
43251
47210
43644
47608
.99
99%
63.66
9.93
5.84
4.60
4.03
3.71
3.50
3.36
3.25
3.17
3.11
3.06
3,01
298
2.95
2.92
2.90
2.88
2.86
2.85
.12100 11900
2.83
2.82
2.81
2.80
2.79
2.78
2.77
2.76
2.76
2.75
2.70
2.66
2.62
2.58
.998
99.8%
318.31
23.33
10.21
7.17
5.89
5.21
4.79
4.50
4.30
4.14
4.03
3.93
3.85
3.79
3.73
3.69
3.65
3.61
3.58
3.55
3.53
3.51
3.49
3.47
3.45
.08226
.09853
11702
14007 .13786
3.44
3.42
3.41
3.40
3.39
.16354
18943
21770 21476
24825
24510
28096
27760
.31561
31207
.35197
34827
38974
38591
42858
42465
46812 46414
3.31
3.23
3.16
3.09
.999
99.9%
636.62
31.60
12.92
8.61
6.86
5.96
5.41
5.04
4.78
4.59
4.44
4.32
4.22
4.14
4.07
.16109
18673
4.02
3.97
3.92
3.88
3.85
3.82
3.79
3.77
3.75
3.73
3.71
3.69
3.67
3.66
3.65
3.55
3.46
3.37
3.29
.09
53586
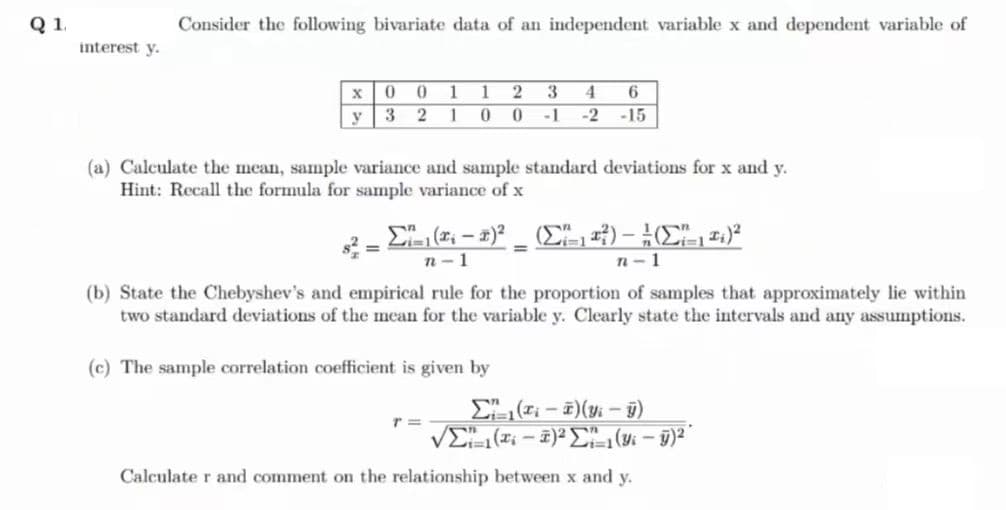
Transcribed Image Text:Q 1.
interest y.
Consider the following bivariate data of an independent variable x and dependent variable of
X
y
00 1 1 2 3 4 6
321 0 0 -1 -2 -15
(a) Calculate the mean, sample variance and sample standard deviations for x and y.
Hint: Recall the formula for sample variance of x
=
Σ'(* - *) _ (Σ"113) - }(Σ11)
n-1
n-1
(b) State the Chebyshev's and empirical rule for the proportion of samples that approximately lie within
two standard deviations of the mean for the variable y. Clearly state the intervals and any assumptions.
(c) The sample correlation coefficient is given by
Σ(₁-7)(y-ÿ)
νΣ( - )2Σ1(: - g)2
Calculate r and comment on the relationship between x and y.
T=
Expert Solution
This question has been solved!
Explore an expertly crafted, step-by-step solution for a thorough understanding of key concepts.

Step by step
Solved in 2 steps with 2 images

Recommended textbooks for you
MATLAB: An Introduction with Applications
Statistics
ISBN:
9781119256830
Author:
Amos Gilat
Publisher:
John Wiley & Sons Inc

Probability and Statistics for Engineering and th…
Statistics
ISBN:
9781305251809
Author:
Jay L. Devore
Publisher:
Cengage Learning

Statistics for The Behavioral Sciences (MindTap C…
Statistics
ISBN:
9781305504912
Author:
Frederick J Gravetter, Larry B. Wallnau
Publisher:
Cengage Learning
MATLAB: An Introduction with Applications
Statistics
ISBN:
9781119256830
Author:
Amos Gilat
Publisher:
John Wiley & Sons Inc
Probability and Statistics for Engineering and th…
Statistics
ISBN:
9781305251809
Author:
Jay L. Devore
Publisher:
Cengage Learning
Statistics for The Behavioral Sciences (MindTap C…
Statistics
ISBN:
9781305504912
Author:
Frederick J Gravetter, Larry B. Wallnau
Publisher:
Cengage Learning

Elementary Statistics: Picturing the World (7th E…
Statistics
ISBN:
9780134683416
Author:
Ron Larson, Betsy Farber
Publisher:
PEARSON

The Basic Practice of Statistics
Statistics
ISBN:
9781319042578
Author:
David S. Moore, William I. Notz, Michael A. Fligner
Publisher:
W. H. Freeman

Introduction to the Practice of Statistics
Statistics
ISBN:
9781319013387
Author:
David S. Moore, George P. McCabe, Bruce A. Craig
Publisher:
W. H. Freeman